fig, ax = plt.subplots(dpi=123, figsize=(12, 6))
dia = PerformanceDiagram(ax, df.iloc[:, 5], df.iloc[:, 6:], bounds=[0, 1, 0, 1])
fig.legend(dia.points, [p.get_label() for p in dia.points], loc='lower center',
           ncol=7, frameon=False, bbox_to_anchor=(0.1, 0, 0.8, 0.1))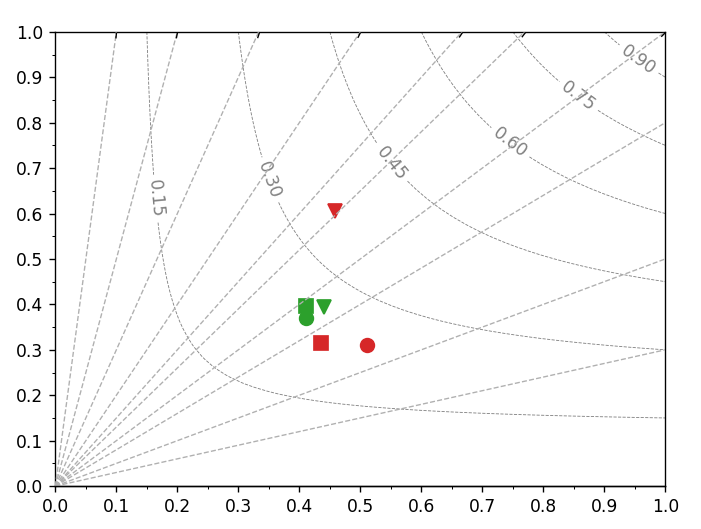
其他详细信息参考泰勒图