import pandas as pd
import matplotlib.pyplot as plt
import seaborn as sns
import warnings
warnings.filterwarnings("ignore")
df = pd.read_excel('./EMEA_Rawdata_EXT-1.xlsx')
<style scoped>
.dataframe tbody tr th:only-of-type {
vertical-align: middle;
}
.dataframe tbody tr th {
    vertical-align: top;
}

.dataframe thead th {
    text-align: right;
}
</style>
|
Year |
Month |
TARGET VARIABLE |
EMEA, Business Confidence Indicator (BCI) |
EMEA, CLI Normalized |
EMEA, Consumer Confidence Indicator (CCI) |
EMEA, Crude oil prices |
EMEA, Employment Rate |
EMEA, GDP Normalized |
EMEA, Germany ifo Business Climate |
... |
EMEA, Production of total construction Index |
EMEA, Production of total industry Index |
EMEA, Production of total manufactured intermediate goods Index |
EMEA, Production of total manufactured investment goods Index |
EMEA, Residential Property Sales of Newly Built Dwelings |
EMEA, VDMA Agriculture |
EMEA, VDMA Construction |
EMEA, VDMA Machine Building |
EMEA, VDMA Material Handling |
EMEA, VDMA Oil Hydraulic |
| 0 |
2008 |
3 |
56.470288 |
99.386446 |
99.557885 |
98.749106 |
168.633416 |
101.237421 |
101.316538 |
95.536268 |
... |
100.982924 |
102.760351 |
102.130085 |
105.519810 |
103.477218 |
152.230259 |
78.222050 |
101.729730 |
109.491247 |
99.525480 |
| 1 |
2008 |
4 |
58.276205 |
99.252286 |
99.302441 |
98.489578 |
170.615133 |
101.084697 |
101.189693 |
95.020105 |
... |
99.455811 |
103.044570 |
102.162637 |
105.808424 |
103.040339 |
147.498286 |
79.617964 |
108.737317 |
130.367913 |
96.626406 |
| 2 |
2008 |
5 |
56.868989 |
99.107791 |
99.027786 |
98.153161 |
182.792208 |
100.932420 |
101.021160 |
95.629424 |
... |
97.941626 |
101.939318 |
100.863572 |
104.296346 |
102.608352 |
139.180835 |
74.803818 |
102.905501 |
109.939324 |
87.821297 |
| 3 |
2008 |
6 |
56.320007 |
98.953695 |
98.723806 |
97.763344 |
190.765916 |
100.780587 |
100.801965 |
94.756323 |
... |
97.617816 |
101.186758 |
99.971225 |
103.435500 |
102.181175 |
137.021093 |
74.743418 |
102.995057 |
102.128778 |
88.591610 |
| 4 |
2008 |
7 |
52.344385 |
98.797412 |
98.384961 |
97.426953 |
191.471205 |
100.645817 |
100.524887 |
93.881988 |
... |
97.589115 |
99.193298 |
98.533633 |
100.565160 |
101.651005 |
126.194468 |
66.202091 |
91.503987 |
85.019864 |
79.475532 |
5 rows × 24 columns
<style scoped>
.dataframe tbody tr th:only-of-type {
vertical-align: middle;
}
.dataframe tbody tr th {
    vertical-align: top;
}

.dataframe thead th {
    text-align: right;
}
</style>
|
Year |
Month |
TARGET VARIABLE |
EMEA, Business Confidence Indicator (BCI) |
EMEA, CLI Normalized |
EMEA, Consumer Confidence Indicator (CCI) |
EMEA, Crude oil prices |
EMEA, Employment Rate |
EMEA, GDP Normalized |
EMEA, Germany ifo Business Climate |
... |
EMEA, Production of total construction Index |
EMEA, Production of total industry Index |
EMEA, Production of total manufactured intermediate goods Index |
EMEA, Production of total manufactured investment goods Index |
EMEA, Residential Property Sales of Newly Built Dwelings |
EMEA, VDMA Agriculture |
EMEA, VDMA Construction |
EMEA, VDMA Machine Building |
EMEA, VDMA Material Handling |
EMEA, VDMA Oil Hydraulic |
| count |
173.000000 |
173.000000 |
173.000000 |
173.000000 |
173.000000 |
173.000000 |
172.000000 |
134.000000 |
173.000000 |
173.000000 |
... |
171.000000 |
171.000000 |
139.000000 |
138.000000 |
134.000000 |
171.000000 |
171.000000 |
171.000000 |
171.000000 |
171.000000 |
| mean |
2014.878613 |
6.456647 |
51.725141 |
100.165468 |
99.911169 |
99.955067 |
108.435237 |
100.267461 |
99.799266 |
99.665680 |
... |
99.110029 |
99.998665 |
99.514440 |
100.782788 |
100.995202 |
104.581690 |
105.038129 |
102.127317 |
102.876076 |
107.216767 |
| std |
4.186392 |
3.429459 |
11.779169 |
2.055684 |
1.853292 |
1.466436 |
41.132747 |
1.088957 |
3.153513 |
8.265685 |
... |
4.844012 |
6.651863 |
7.532978 |
8.088812 |
2.515453 |
22.335711 |
33.182226 |
20.095164 |
19.591777 |
41.531314 |
| min |
2008.000000 |
1.000000 |
20.127824 |
95.690428 |
95.194252 |
93.944354 |
40.647561 |
97.362329 |
86.281709 |
78.049565 |
... |
81.492718 |
80.244924 |
73.384132 |
75.120385 |
96.432692 |
52.173913 |
38.325282 |
49.435347 |
48.908297 |
25.925129 |
| 25% |
2011.000000 |
4.000000 |
45.223723 |
98.867598 |
98.779094 |
99.273158 |
82.027291 |
99.468618 |
99.126682 |
95.629424 |
... |
95.921830 |
97.915707 |
98.053737 |
98.570519 |
98.705175 |
91.913967 |
89.015152 |
93.725156 |
93.814882 |
85.104796 |
| 50% |
2015.000000 |
6.000000 |
51.405531 |
100.024729 |
99.920269 |
99.928411 |
106.501051 |
100.404376 |
100.190961 |
99.665775 |
... |
99.268112 |
100.968188 |
100.863572 |
102.100331 |
101.116503 |
99.567100 |
102.601156 |
100.911002 |
102.091633 |
98.219788 |
| 75% |
2018.000000 |
9.000000 |
57.453146 |
101.027189 |
100.937885 |
100.774643 |
125.504250 |
101.285165 |
100.676776 |
103.551278 |
... |
102.015713 |
102.973053 |
103.007853 |
105.431430 |
103.456908 |
119.743590 |
116.931156 |
107.602311 |
113.114878 |
123.806617 |
| max |
2022.000000 |
12.000000 |
81.893651 |
106.939196 |
105.027933 |
103.489160 |
254.561356 |
101.608496 |
110.900657 |
123.970037 |
... |
123.641102 |
124.529812 |
113.718002 |
114.601585 |
105.760494 |
167.452077 |
236.158192 |
156.682028 |
175.103734 |
266.117065 |
8 rows × 24 columns
Year                                                                0
Month                                                               0
TARGET VARIABLE                                                     0
EMEA, Business Confidence Indicator (BCI)                           0
EMEA, CLI Normalized                                                0
EMEA, Consumer Confidence Indicator (CCI)                           0
EMEA, Crude oil prices                                              1
EMEA, Employment Rate                                              39
EMEA, GDP Normalized                                                0
EMEA, Germany ifo Business Climate                                  0
EMEA, ifo Business Expectations                                     0
EMEA, ifo Business Situation                                        0
EMEA, PMI                                                           0
EMEA, Production in total manufacturing Index                       2
EMEA, Production of total construction Index                        2
EMEA, Production of total industry Index                            2
EMEA, Production of total manufactured intermediate goods Index    34
EMEA, Production of total manufactured investment goods Index      35
EMEA, Residential Property Sales of Newly Built Dwelings           39
EMEA, VDMA Agriculture                                              2
EMEA, VDMA Construction                                             2
EMEA, VDMA Machine Building                                         2
EMEA, VDMA Material Handling                                        2
EMEA, VDMA Oil Hydraulic                                            2
dtype: int64
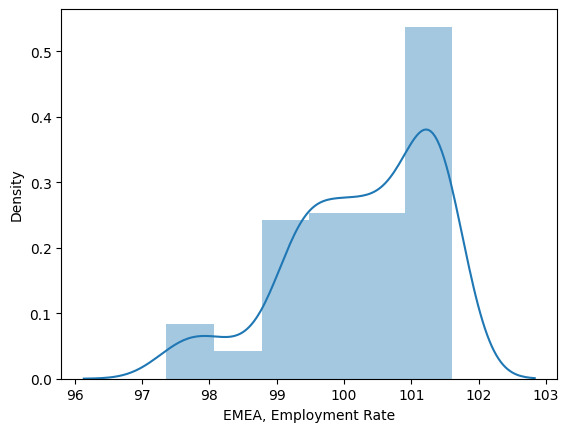
print('Median :',df['EMEA, Employment Rate'].median())
sns.distplot(df['EMEA, Employment Rate'])
Mean : 100.26746101491987
Mean : 100.4043764098456
<AxesSubplot:xlabel='EMEA, Employment Rate', ylabel='Density'>
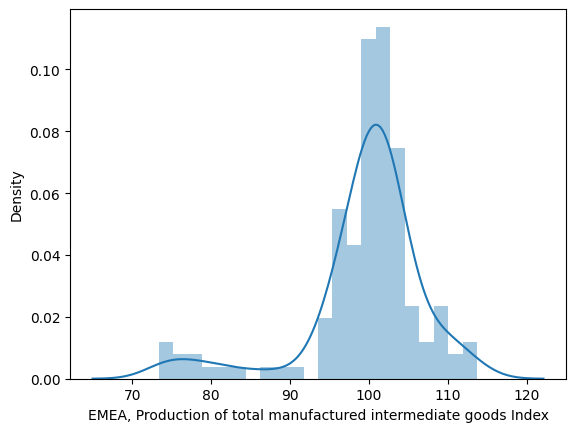
print('Mean :',df['EMEA, Production of total manufactured intermediate goods Index'].mean())
sns.distplot(df['EMEA, Production of total manufactured intermediate goods Index'])
Mean : 99.51443961655384
Median : 100.86357237650813
<AxesSubplot:xlabel='EMEA, Production of total manufactured intermediate goods Index', ylabel='Density'>
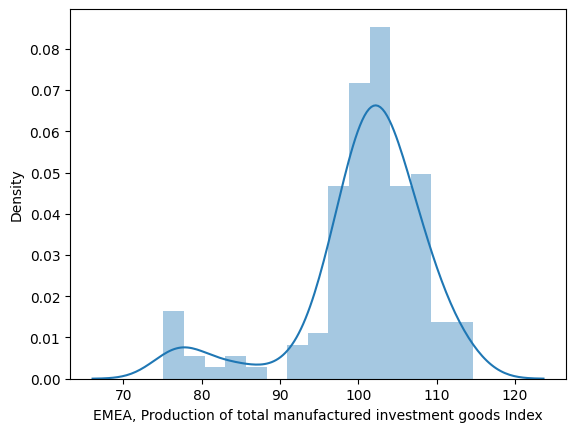
x = 'EMEA, Production of total manufactured investment goods Index'
print('Mean :',df[x].mean())
sns.distplot(df[x])
Mean : 100.7827876363584
Median : 102.10033114077632
<AxesSubplot:xlabel='EMEA, Production of total manufactured investment goods Index', ylabel='Density'>
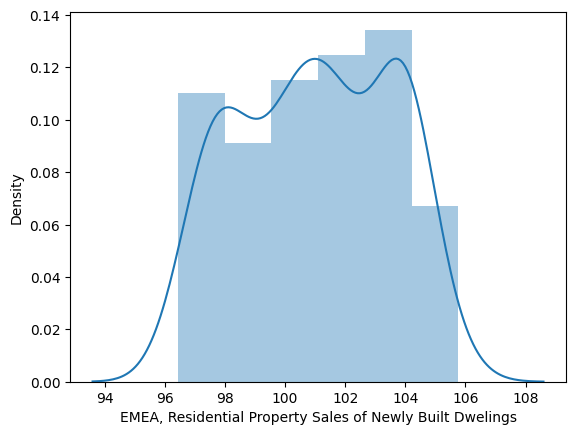
x = 'EMEA, Residential Property Sales of Newly Built Dwelings'
print('Mean :',df[x].mean())
sns.distplot(df[x])
Mean : 100.99520227279922
Median : 101.11650292217311
<AxesSubplot:xlabel='EMEA, Residential Property Sales of Newly Built Dwelings', ylabel='Density'>
# x = df
# fig, axes = plt.subplots(ncols=2, figsize=(12, 4))
# for ax in axes:
#     sns.kdeplot(x, shade=False, color='crimson', ax=ax)
#     kdeline = ax.lines[0]
#     xs = kdeline.get_xdata()
#     ys = kdeline.get_ydata()
#     if ax == axes[0]:
#         middle = x.mean()
#         sdev = x.std()
#         left = middle - sdev
#         right = middle + sdev
#         ax.set_title('Showing mean and sdev')
#     else:
#         left, middle, right = np.percentile(x, [25, 50, 75])
#         ax.set_title('Showing median and quartiles')
#     ax.vlines(middle, 0, np.interp(middle, xs, ys), color='crimson', ls=':')
#     ax.fill_between(xs, 0, ys, facecolor='crimson', alpha=0.2)
#     ax.fill_between(xs, 0, ys, where=(left <= xs) & (xs <= right), interpolate=True, facecolor='crimson', alpha=0.2)
#     # ax.set_ylim(ymin=0)
# plt.show()
# for index,col in df.iterrows():
# if(df[index] )
list_for_replaceing_zero = ['EMEA, VDMA Agriculture',
'EMEA, VDMA Construction',
'EMEA, VDMA Machine Building',
'EMEA, VDMA Material Handling',
'EMEA, VDMA Oil Hydraulic',
'EMEA, Production in total manufacturing Index',
'EMEA, Production of total construction Index',
'EMEA, Production of total industry Index']
for col in list_for_replaceing_zero:
df[col] = df[col].replace(0, df[col].mean())x = 'EMEA, Production of total manufactured investment goods Index'
df[x] = df[x].replace(np.nan, df[x].median())
x = 'EMEA, Employment Rate'
df[x] = df[x].replace(np.nan, df[x].median())
x = 'EMEA, Production of total manufactured intermediate goods Index'
df[x] = df[x].replace(np.nan, df[x].mean())
x = 'EMEA, Residential Property Sales of Newly Built Dwelings'
df[x] = df[x].replace(np.nan, df[x].mean())
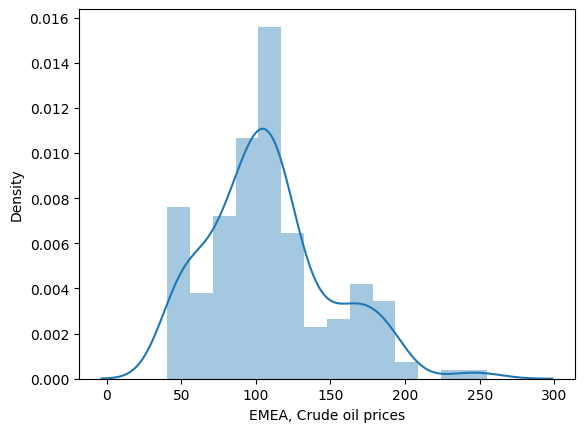
x = 'EMEA, Crude oil prices'
print('Mean :',df[x].mean())
sns.distplot(df[x])
Mean : 108.43523655794415
Median : 106.50105081408314
<AxesSubplot:xlabel='EMEA, Crude oil prices', ylabel='Density'>
x = 'EMEA, Crude oil prices'
df[x] = df[x].replace(np.nan, df[x].mean())
Year                                                               0
Month                                                              0
TARGET VARIABLE                                                    0
EMEA, Business Confidence Indicator (BCI)                          0
EMEA, CLI Normalized                                               0
EMEA, Consumer Confidence Indicator (CCI)                          0
EMEA, Crude oil prices                                             0
EMEA, Employment Rate                                              0
EMEA, GDP Normalized                                               0
EMEA, Germany ifo Business Climate                                 0
EMEA, ifo Business Expectations                                    0
EMEA, ifo Business Situation                                       0
EMEA, PMI                                                          0
EMEA, Production in total manufacturing Index                      0
EMEA, Production of total construction Index                       0
EMEA, Production of total industry Index                           0
EMEA, Production of total manufactured intermediate goods Index    0
EMEA, Production of total manufactured investment goods Index      0
EMEA, Residential Property Sales of Newly Built Dwelings           0
EMEA, VDMA Agriculture                                             0
EMEA, VDMA Construction                                            0
EMEA, VDMA Machine Building                                        0
EMEA, VDMA Material Handling                                       0
EMEA, VDMA Oil Hydraulic                                           0
dtype: int64
<style scoped>
.dataframe tbody tr th:only-of-type {
vertical-align: middle;
}
.dataframe tbody tr th {
    vertical-align: top;
}

.dataframe thead th {
    text-align: right;
}
</style>
|
Year |
Month |
TARGET VARIABLE |
EMEA, Business Confidence Indicator (BCI) |
EMEA, CLI Normalized |
EMEA, Consumer Confidence Indicator (CCI) |
EMEA, Crude oil prices |
EMEA, Employment Rate |
EMEA, GDP Normalized |
EMEA, Germany ifo Business Climate |
... |
EMEA, Production of total construction Index |
EMEA, Production of total industry Index |
EMEA, Production of total manufactured intermediate goods Index |
EMEA, Production of total manufactured investment goods Index |
EMEA, Residential Property Sales of Newly Built Dwelings |
EMEA, VDMA Agriculture |
EMEA, VDMA Construction |
EMEA, VDMA Machine Building |
EMEA, VDMA Material Handling |
EMEA, VDMA Oil Hydraulic |
| 0 |
2008 |
3 |
56.470288 |
99.386446 |
99.557885 |
98.749106 |
168.633416 |
101.237421 |
101.316538 |
95.536268 |
... |
100.982924 |
102.760351 |
102.130085 |
105.519810 |
103.477218 |
152.230259 |
78.222050 |
101.729730 |
109.491247 |
99.525480 |
| 1 |
2008 |
4 |
58.276205 |
99.252286 |
99.302441 |
98.489578 |
170.615133 |
101.084697 |
101.189693 |
95.020105 |
... |
99.455811 |
103.044570 |
102.162637 |
105.808424 |
103.040339 |
147.498286 |
79.617964 |
108.737317 |
130.367913 |
96.626406 |
| 2 |
2008 |
5 |
56.868989 |
99.107791 |
99.027786 |
98.153161 |
182.792208 |
100.932420 |
101.021160 |
95.629424 |
... |
97.941626 |
101.939318 |
100.863572 |
104.296346 |
102.608352 |
139.180835 |
74.803818 |
102.905501 |
109.939324 |
87.821297 |
| 3 |
2008 |
6 |
56.320007 |
98.953695 |
98.723806 |
97.763344 |
190.765916 |
100.780587 |
100.801965 |
94.756323 |
... |
97.617816 |
101.186758 |
99.971225 |
103.435500 |
102.181175 |
137.021093 |
74.743418 |
102.995057 |
102.128778 |
88.591610 |
| 4 |
2008 |
7 |
52.344385 |
98.797412 |
98.384961 |
97.426953 |
191.471205 |
100.645817 |
100.524887 |
93.881988 |
... |
97.589115 |
99.193298 |
98.533633 |
100.565160 |
101.651005 |
126.194468 |
66.202091 |
91.503987 |
85.019864 |
79.475532 |
5 rows × 24 columns
mask = np.zeros_like(df.corr(), dtype=np.bool)
mask[np.triu_indices_from(mask)] = True
plt.figure(figsize=(16,12))
plt.title('Correlation of EMEA Business Index')
ax = sns.heatmap(df.corr(), square=True,  fmt='.2f', annot=True, linecolor='white')
ax.set_xticklabels(ax.get_xticklabels(), rotation=90)
ax.set_yticklabels(ax.get_yticklabels(), rotation=0)
plt.show()
cols= ['EMEA, Business Confidence Indicator (BCI)',
'EMEA, CLI Normalized',
'EMEA, Consumer Confidence Indicator (CCI)',
      'EMEA, ifo Business Expectations',
      'EMEA, ifo Business Situation']
plt.figure(figsize=(16,30))
for i,col in enumerate(df[cols].columns):
    plt.subplot(6,3,i+1)

    sns.boxplot(data=df,x=col)
Index(['Year', 'Month', 'TARGET VARIABLE',
       'EMEA, Business Confidence Indicator (BCI)', 'EMEA, CLI Normalized',
       'EMEA, Consumer Confidence Indicator (CCI)', 'EMEA, Crude oil prices',
       'EMEA, Employment Rate', 'EMEA, GDP Normalized',
       'EMEA, Germany ifo Business Climate', 'EMEA, ifo Business Expectations',
       'EMEA, ifo Business Situation', 'EMEA, PMI',
       'EMEA, Production in total manufacturing Index',
       'EMEA, Production of total construction Index',
       'EMEA, Production of total industry Index',
       'EMEA, Production of total manufactured intermediate goods Index',
       'EMEA, Production of total manufactured investment goods Index',
       'EMEA, Residential Property Sales of Newly Built Dwelings',
       'EMEA, VDMA Agriculture', 'EMEA, VDMA Construction',
       'EMEA, VDMA Machine Building', 'EMEA, VDMA Material Handling',
       'EMEA, VDMA Oil Hydraulic'],
      dtype='object')
another_cols = ['BCI','CLI','CCI',
                'mintg_index',
                'minvg_index',
                'germany_ifo_bc',
                'vdma_construction',
                'vdma_machine_building',
                'vdma_machine_handling',
                'vdma_oil_hydraulic',
                'industry_index']
plt.figure(figsize=(16,30))
for i,col in enumerate(df[another_cols].columns):
    plt.subplot(6,3,i+1)

    sns.boxplot(data=df,x=col)
mask = np.zeros_like(df.corr(), dtype=np.bool)
mask[np.triu_indices_from(mask)] = True
plt.figure(figsize=(16,12))
plt.title('Correlation of EMEA Business Index')
ax = sns.heatmap(df[another_cols].corr(), square=True,  fmt='.2f', annot=True, linecolor='white')
ax.set_xticklabels(ax.get_xticklabels(), rotation=90)
ax.set_yticklabels(ax.get_yticklabels(), rotation=0)
plt.show()
sns.pairplot(df[another_cols])
plt.show()

from patsy import dmatrices
from statsmodels.stats.outliers_influence import variance_inflation_factor
df.rename(columns = {'EMEA, ifo Business Situation':'ifo_bs','EMEA, Business Confidence Indicator (BCI)':'BCI',
                     "EMEA, CLI Normalized":"CLI",
                     "EMEA, Consumer Confidence Indicator (CCI)":"CCI",
                     "EMEA, Production of total manufactured intermediate goods Index":"mintg_index",
                     "EMEA, Production of total manufactured investment goods Index":"minvg_index",
                     "EMEA, Germany ifo Business Climate":"germany_ifo_bc",
                     'EMEA, VDMA Construction':"vdma_construction",
                     'EMEA, VDMA Machine Building':"vdma_machine_building",
                     'EMEA, VDMA Material Handling':"vdma_machine_handling",
                     'EMEA, VDMA Oil Hydraulic':"vdma_oil_hydraulic",
                     'EMEA, GDP Normalized':"GDP",
                     'EMEA, Production of total industry Index':'industry_index'
}, inplace = True)Index(['Year', 'Month', 'TARGET VARIABLE', 'BCI', 'CLI', 'CCI',
'EMEA, Crude oil prices', 'EMEA, Employment Rate', 'GDP',
'germany_ifo_bc', 'EMEA, ifo Business Expectations', 'ifo_bs',
'EMEA, PMI', 'EMEA, Production in total manufacturing Index',
'EMEA, Production of total construction Index', 'industry_index',
'mintg_index', 'minvg_index',
'EMEA, Residential Property Sales of Newly Built Dwelings',
'EMEA, VDMA Agriculture', 'vdma_construction', 'vdma_machine_building',
'vdma_machine_handling', 'vdma_oil_hydraulic'],
dtype='object')
y, X = dmatrices('ifo_bs ~ BCI+CLI+CCI+mintg_index+minvg_index+germany_ifo_bc+vdma_construction+vdma_machine_building+vdma_machine_handling+vdma_oil_hydraulic+industry_index', data=df, return_type='dataframe')

#calculate VIF for each explanatory variable
vif = pd.DataFrame()
vif['VIF'] = [variance_inflation_factor(X.values, i) for i in range(X.shape[1])]
vif['variable'] = X.columns
<style scoped>
.dataframe tbody tr th:only-of-type {
vertical-align: middle;
}
.dataframe tbody tr th {
    vertical-align: top;
}

.dataframe thead th {
    text-align: right;
}
</style>
|
VIF |
variable |
| 0 |
36437.140963 |
Intercept |
| 1 |
15.667783 |
BCI |
| 2 |
25.734172 |
CLI |
| 3 |
3.906233 |
CCI |
| 4 |
12.414092 |
mintg_index |
| 5 |
10.085800 |
minvg_index |
| 6 |
18.013872 |
germany_ifo_bc |
| 7 |
8.097798 |
vdma_construction |
| 8 |
13.868185 |
vdma_machine_building |
| 9 |
5.594963 |
vdma_machine_handling |
| 10 |
9.386626 |
vdma_oil_hydraulic |
| 11 |
9.150703 |
industry_index |
from sklearn.model_selection import train_test_split
from sklearn.linear_model import LinearRegression

X_train, X_test, y_train, y_test = train_test_split(X, y, test_size = 0.6)

# Splitting the data into training and testing data
regr = LinearRegression()

regr.fit(X_train, y_train)
print(regr.score(X_test, y_test))
y_pred = regr.predict(X_test)
print(len(X_test),len(y_test),len(y_pred))
from sklearn.metrics import mean_absolute_error,mean_squared_error

mae = mean_absolute_error(y_true=y_test,y_pred=y_pred)
#squared True returns MSE value, False returns RMSE value.
mse = mean_squared_error(y_true=y_test,y_pred=y_pred) #default=True
rmse = mean_squared_error(y_true=y_test,y_pred=y_pred,squared=False)

print("MAE:",mae)
print("MSE:",mse)
print("RMSE:",rmse)
MAE: 2.438595369259478
MSE: 11.146660341532778
RMSE: 3.338661459557225
<style scoped>
.dataframe tbody tr th:only-of-type {
vertical-align: middle;
}
.dataframe tbody tr th {
    vertical-align: top;
}

.dataframe thead th {
    text-align: right;
}
</style>
|
Intercept |
BCI |
CLI |
CCI |
mintg_index |
minvg_index |
germany_ifo_bc |
vdma_construction |
vdma_machine_building |
vdma_machine_handling |
vdma_oil_hydraulic |
industry_index |
| 131 |
1.0 |
99.024828 |
98.590559 |
99.250891 |
99.016026 |
97.686899 |
95.004773 |
91.304348 |
90.909091 |
105.555556 |
85.294118 |
98.498592 |
| 83 |
1.0 |
99.867840 |
99.908364 |
100.700707 |
99.597042 |
104.438082 |
97.723524 |
99.030787 |
103.240109 |
99.640875 |
95.891257 |
101.507366 |
| 49 |
1.0 |
98.481567 |
97.863164 |
99.091196 |
95.238091 |
100.869880 |
97.190461 |
90.340254 |
90.231440 |
94.449641 |
73.723849 |
98.033989 |
| 114 |
1.0 |
101.010070 |
100.815830 |
100.791176 |
104.735284 |
105.880410 |
103.551278 |
128.761984 |
111.804808 |
125.886232 |
142.032164 |
104.014478 |
| 162 |
1.0 |
105.868385 |
102.128378 |
103.275920 |
99.514440 |
102.100331 |
108.366534 |
196.442688 |
150.592885 |
112.149533 |
133.437500 |
106.682659 |
| ... |
... |
... |
... |
... |
... |
... |
... |
... |
... |
... |
... |
... |
| 10 |
1.0 |
96.242821 |
95.731810 |
97.914617 |
80.683766 |
85.681744 |
79.684482 |
39.749781 |
61.032739 |
67.214076 |
30.135513 |
87.212511 |
| 135 |
1.0 |
98.627887 |
98.566941 |
99.598047 |
99.715410 |
95.426295 |
96.022172 |
92.857143 |
92.261905 |
100.578035 |
66.666667 |
97.076391 |
| 146 |
1.0 |
97.167667 |
96.007907 |
98.067325 |
99.514440 |
102.100331 |
80.856084 |
58.571429 |
78.476821 |
83.928571 |
79.141104 |
80.244924 |
| 43 |
1.0 |
99.597888 |
99.471974 |
99.041033 |
101.655608 |
106.413662 |
97.880093 |
116.363636 |
104.403670 |
115.446128 |
105.357686 |
101.950051 |
| 151 |
1.0 |
99.130144 |
99.656153 |
97.980132 |
99.514440 |
102.100331 |
98.061332 |
110.067114 |
92.041522 |
113.013699 |
124.528302 |
94.909794 |
104 rows × 12 columns


