Welcome to rouTracer, a clone of the social media fitness app Strava. It was made over the course of several weeks in October 2018. Check it out here!
rouTracer's front end is implemented with React, Redux, Recharts (a graphing API), several Google APIs (Maps, Directions, Elevation), and React-Search-Input (search bar), with Webpack as a Bundler.
rouTracer's back end is built with Ruby on Rails, PostgreSQL, AJAX, and JBuilder (a DSL that provides syntax for structuring JSON responses).
RouteBuilder constitutes the core functionality of the app, providing the user an interface for mapping and saving a path on an embedded Google Map. Once a user has created and saved a route, they can use it to generate workout objects that appear on their feed and contribute to monthly/weekly totals.
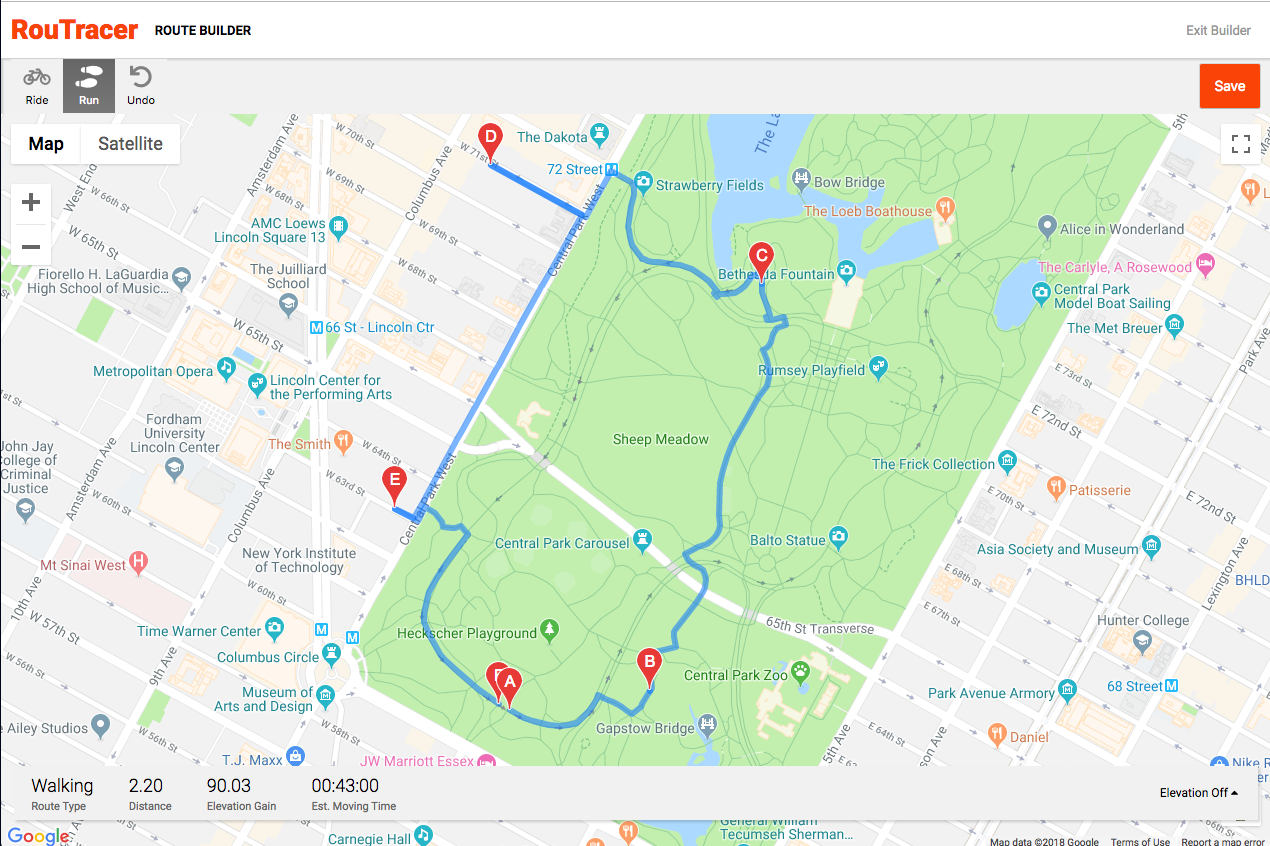
For the time being, users can interact with the map in the following ways: click to create new wayPoints on the map, drag existing waypoints, undo clicks or drags, and toggle between bike routing and pedestrian routing. A status bar at the map's bottom displays cumulative distance, elevation gain, and estimated moving time. It is also simple to save, edit and delete routes.
Due to the nature of Google's Directions Display object, I found it preferable to create said object in componentDidMount and store it in local state, updating it with React's setState every time the user clicks on the map or drags an existing point or path.
A feature embedded within RouteBuilder, the elevation graph makes a call to the Google Elevation API every time the user clicks or drags their path and displays the results on a graph at the bottom of the screen.
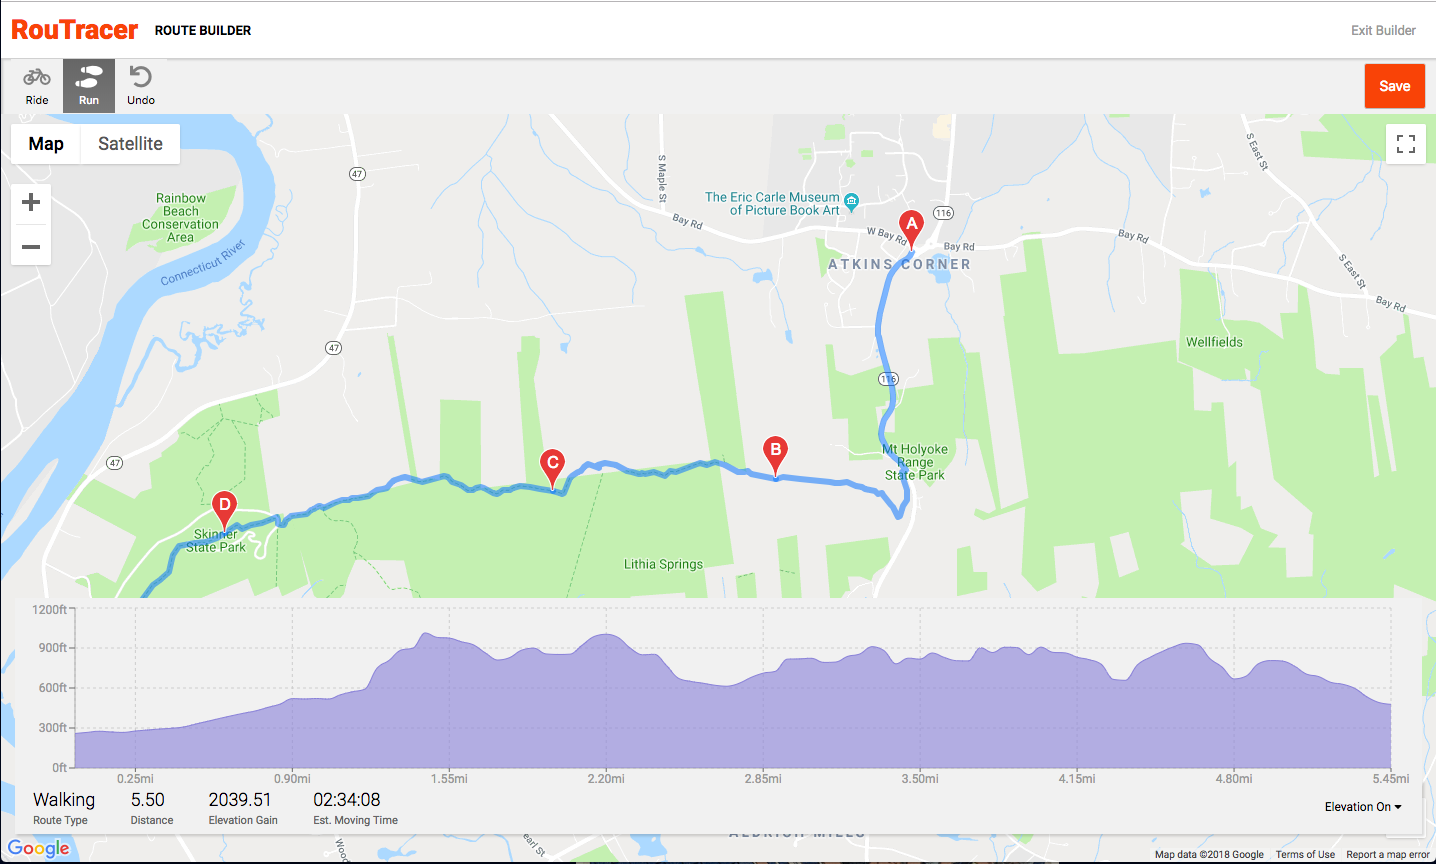
Due to the asynchronous nature of the Elevation API, the function that makes the GET request for elevations returns a promise. On successful resolution, a call to setState is made that triggers a re-render of a functional graph component (which is constructed with an area graph from the Recharts API). The GET request is structured to ask for 20 elevation points per mile until the API's locations per request limit is reached; after this point, it requests the maximum amount of locations and chunks the graph's data object into 500 equidistant intervals.
The dashboard functions as a homepage, displaying a user's activities in chronological order.
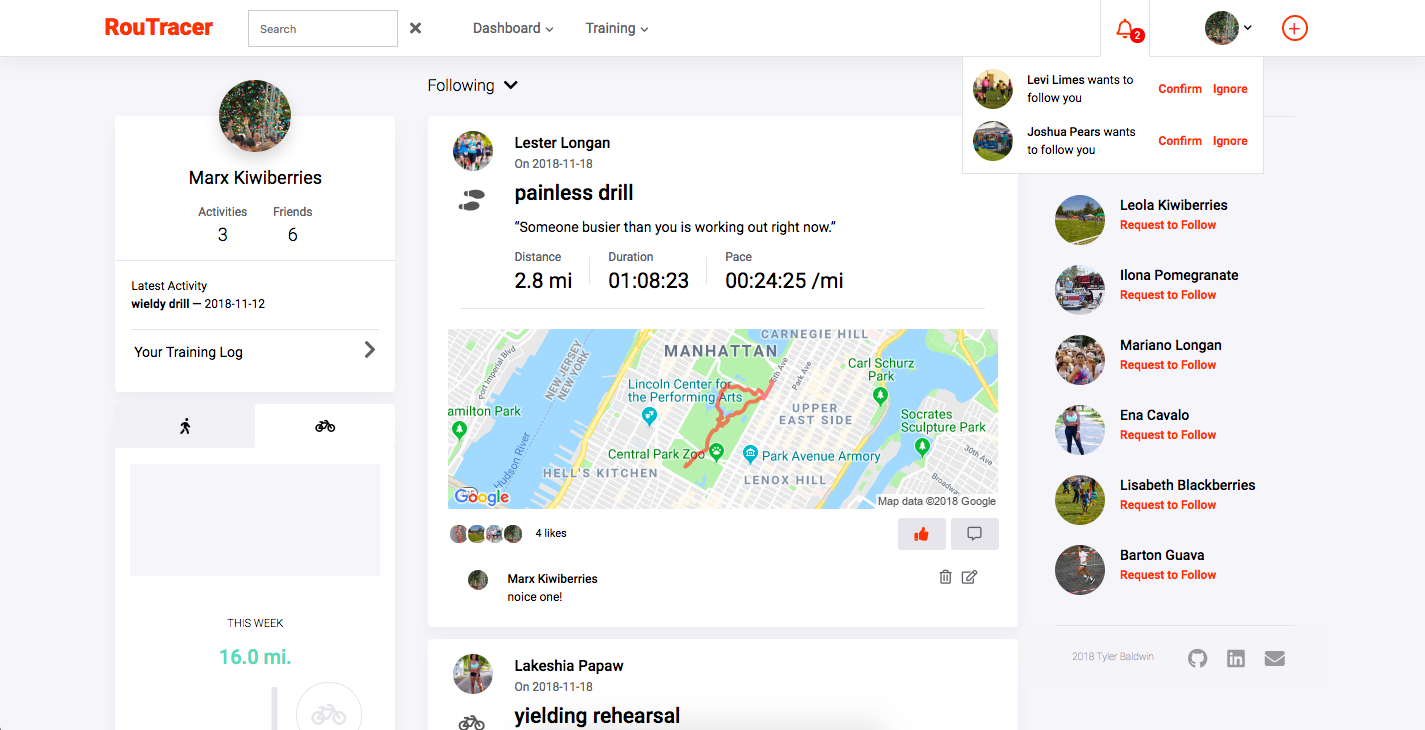
This interface allows the user to toggle whether their feed displays their own recent activity or their friends' activities. On the same page, the user can view suggested friends (for the time being, simply friends of existing friends) and accept/deny follow requests from other users. There is also a small sidebar on the left that facilitates interaction with the current user's past 7 days of workout data.
- Loading UI
- Infinite scroll for dashboard feed