There are a number of genes within the Tryptase family all of which are closely related. The two main genes within the family are the TPSAB1 and TPSB2 known as alpha and beta respectively.
There is evidence that duplication of the TPSAB1 gene is linked to certain phenotypic traits. For example susceptibility to infection [1,2,3]
Duplication of the TPSAB1 locus is associated with a number of SNPs at the 5' prime end of the transcript. These SNPs allow the duplicated TPSAB1 and wild-type TPSAB1 to be distinguished from each other.
This project uses these SNPs to look for expression of the wild-type and duplicated TPSAB1 in publicly available RNA Seq data from the Sequence Read Archive (SRA).
Detecting gene duplications would not normally be possible from RNA Sequencing data. The SNPs associated with the duplication make this possible.
Figure 1 below shows the strategy. Only reads which cross the region of the transcript with the SNPs are counted.
- magicblast
- samtools
- python3
- pysam
- matplotlib
- seaborn
- pandas
- Note that running this code assumes you have access to a Sun Grid Engine computing cluster. If this is not the case you can edit the create_jobs.sh script to run the code on a normal server.
git clone https://github.com/NCBI-Hackathons/Tryptase_Duplication.git
cd Tryptase_Duplication
For detailed instructions see: https://ncbi.github.io/magicblast/cook/blastdb.html
makeblastdb -in reference_sequences/aab_spliced.fasta -dbtype nucl -parse_seqids -out blast_dbs/aab_spliced
Use the run selector on the SRA: https://www.ncbi.nlm.nih.gov/sra
Alternatively see the accession_lists/ directory e.g accession_lists/Public_AML_RNA_Acc_List.txt for the AML list.
Ensure you also download the run table information as this will allow meta data analysis.
This create a series of jobs ready for submission to the Grid Engine computing cluster. Example below. See comments in the create_jobs.sh script for help.
bash create_jobs.sh accession_lists/Public_AML_RNA_Acc_List.txt aabspliced 1 results jobs grid_job_template.txt
Use the submit_jobs.sh script to submits jobs to the Grid Engine computing cluster.
bash submit_jobs.sh $JOB_FOLDER
Where $JOB_FOLDER is the directory containing the jobs created in the previous step.
Pysam requires the SAMs to be converted into BAMs for some steps. So run the following:
bash process_sams.sh $RESULTS_DIR
Where $RESULTS_DIR is the directory containing the results from the alignments i.e the SAM files created by magicblast
First we count the hits using the run_pipeline.py script. This script will also query the Entrez API to get the spot count of each run in order to normalise the data. This process can take a while.
This program outputs a CSV file for downstream analysis.
Alternatively you can skip normalisation at this step and normalise by the base count in the meta data run table information you downloaded earlier.
Example shown below:
python run_pipeline.py --bam_folder ../results/geuvadis_results --source geu --roi_start 25 --roi_end 45 --email halsteadjs@nih.gov --max_errors 3 --file_comment geu
Open the analysis/notebooks/merge_with_meta.ipynb notebook
Edit the options at the top of the notebook. df_meta = location of the run info table tsv df_data = location of the csv outputted by run_pipeline.py output_name = name of output csv normalise_with_mbases = True if you want to normalise with the mbases attribute
There are a number of notebooks available to creating figures:
- create_scatter_figure.ipynb
- analysis_for_final_meeting.ipynb
The location of the result CSV(s) can be updated at the top of the notebooks.
Here is a comparison of various datasets. Accession lists were gathered from SRA for the following datasets:
- AML
- CML
- Sepsis
- Dengue Fever
- Geuvadis Controls
- Healthy Controls (Multiple Tissues)
Figure 2 shows the number of runs that we had for each data set.
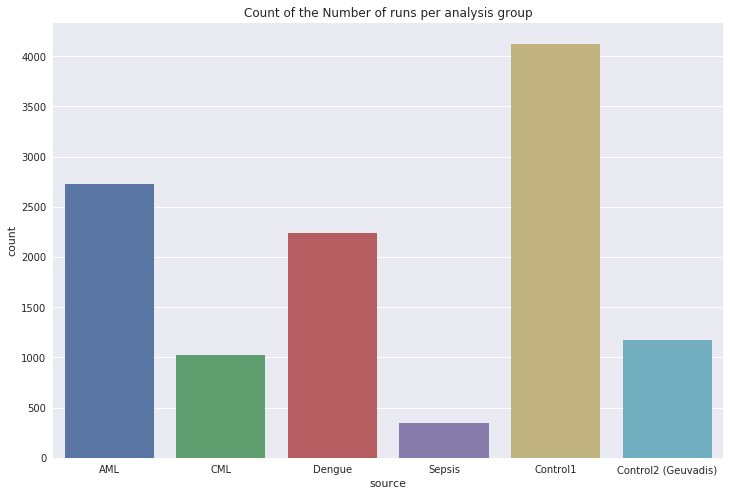 Figure 2: The number of datasets in each group
Figure 3 shows the expression in each of these datasets.
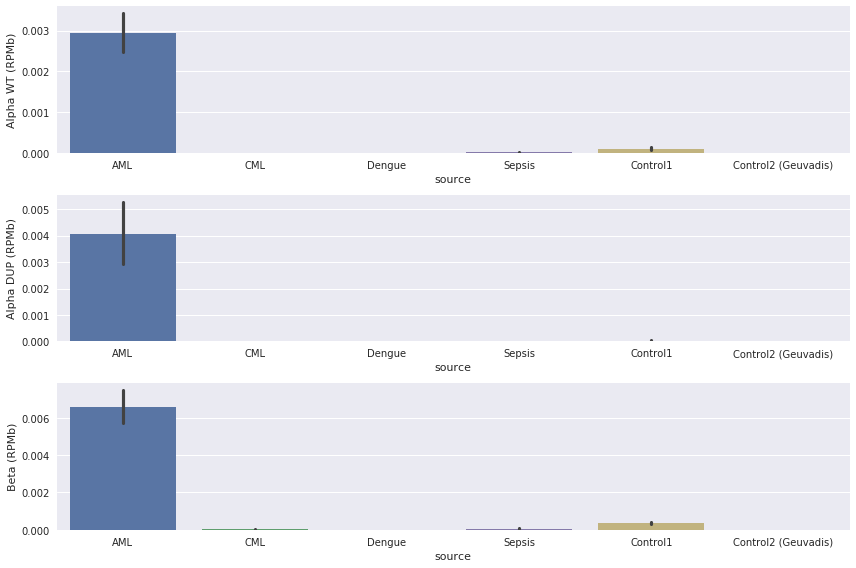 Figure 3: The normalised number of reads crossing the SNP locus.
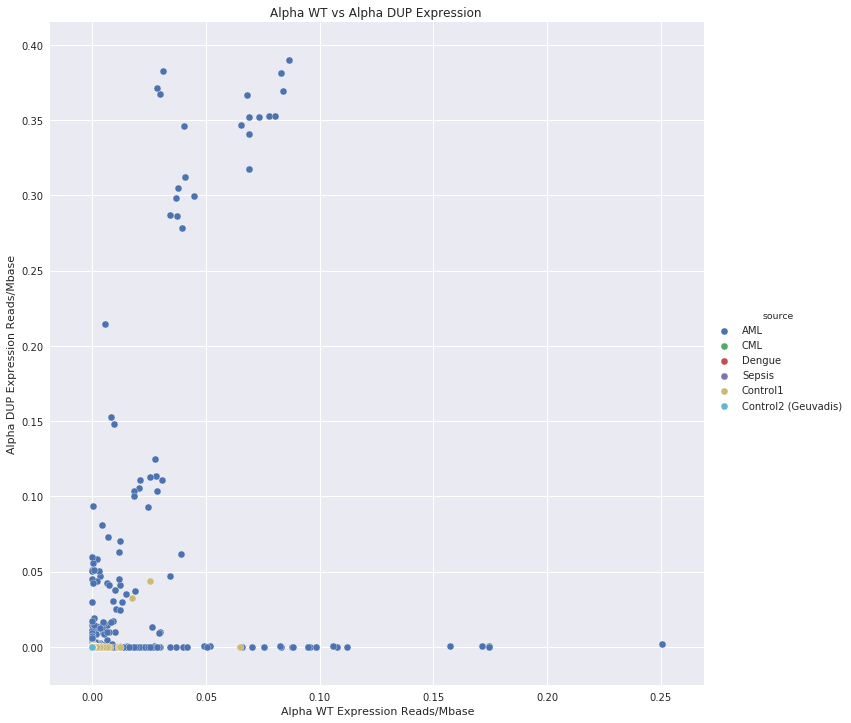
Figure 4 shows the relative normalised read counts in for Alpha Wt and Alpha DUP.
We also looked at the Alpha DUP / Alpha WT ratio in each SRA run. Interesting the top two runs/samples were in the same BioProject (PRJNA386992). This was a study looking at dmins in AML [4].
- SAMN07139337
- SAMN07139333
Figure 5 shows a hisogram of the Alpha DUP / Alpha WT ratios
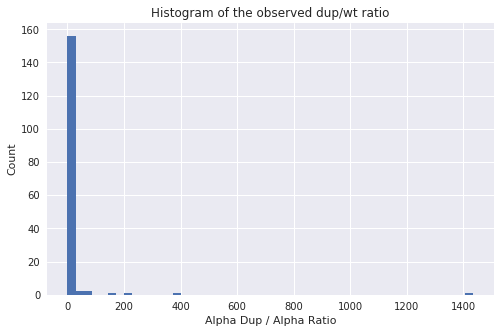 Figure 5: For most runs the ratio is very low although there are some interesting outliers.
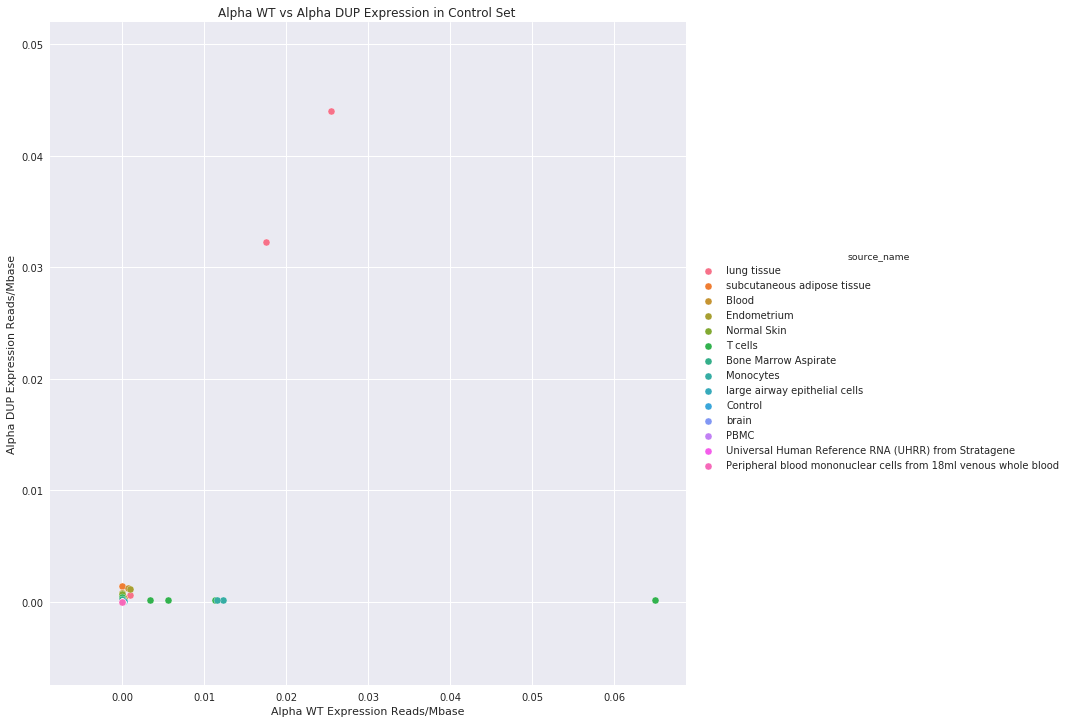 Figure 6: Breakdown of the runs by tissue type
- Look at TCGA data
[1] https://www.nature.com/articles/gim2017136

