This repository contains the code for the ACL 2023 paper BLEURT Has Universal Translations: An Analysis of Automatic Metrics by Minimum Risk Training.
The code is in the process of being organized, I'll get it done as soon as I can.
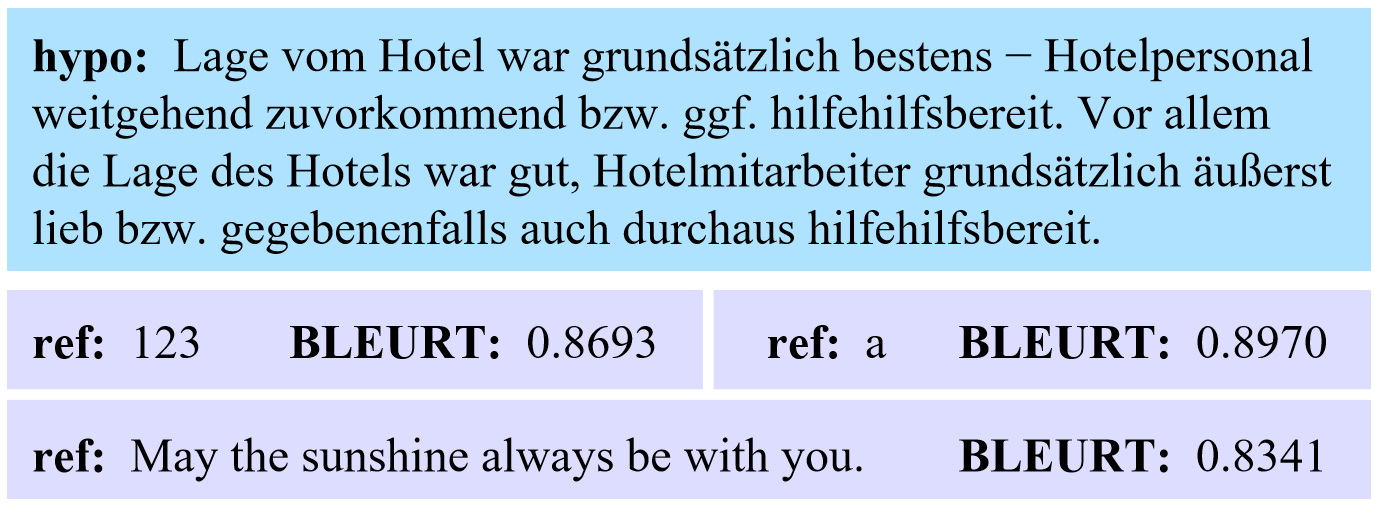
We find universal adversarial translations of BLEURT and BARTScore, which are capable of obtaining high scores when evaluated against any reference sentence.
An example is presented in the figure below:
$hypo$ means the translation sentence and$ref$ means the reference sentence. BLEURT needs to compare$hypo$ and$ref$ to judge the quality of$hypo$ . This figure shows that the universal translation can achieve high BLEURT scores when calculated with each$ref$ , even if$hypo$ and$ref$ are completely unrelated.
# install fairseq
sudo mkdir /usr/lib/python3.7/site-packages
sudo pip3 install -i https://pypi.tuna.tsinghua.edu.cn/simple --editable .
Step1: Maximum Likelihood Estimation (MLE) training phase
Train with conventional negative log-likelihood (NLL) loss
Step 2: MRT training phase
Fine-tune the model with each metric, so as to obtain translation models with various metric styles
# Take En->De as an example, you can run this script to perform step2 (which directly calls the model we pretrained in step 1)
bash mrt_scripts/fairseq_train/mrt_ende_bleurt_beam12.sh
Step1: Generate Hypothesis Sentences from the Training Process
Step2: Calculate the Score of Each Metric
Step3: Plot Training Process Figures
# Take En->De as an example, you can run this script to perform the above three steps:
bash mrt_scripts/fairseq_analysis/mrt_analysis_bleurt_en2de.sh
then you can get a figure like this:

The horizontal axis represents the training steps, and the vertical axis is the score of each metric (except for BARTScore on the right axis, which is a negative number because it calculates the logarithmic probability of translations); metrics other than BARTScore and BLEU are mostly distributed between 0 and 1, and we multiply them uniformly by 100 for ease of observation. The asterisk represents the highest value achieved by the optimized metric.
There may be universal translations if you find a circumstance where only one metric improves while the other declines.
