Table of Contents
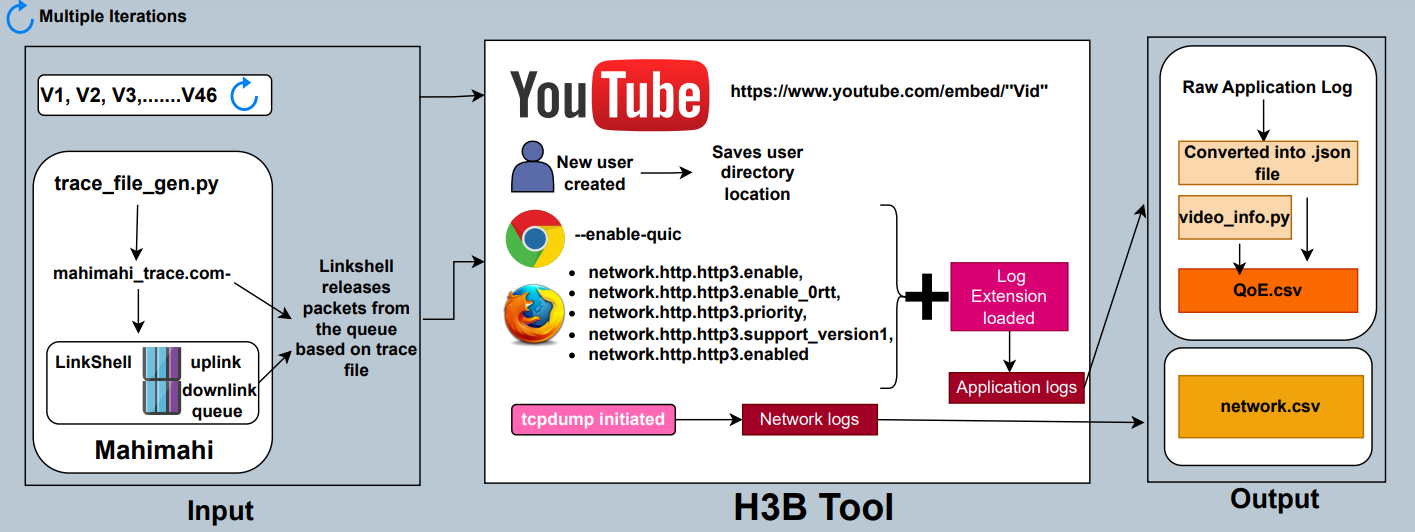
This section provides instructions on how to run the experimental setup and manipulate the input parameters to obtain the desired output. Follow the steps below:
- Create the following folder hierarchy inside the automated folder:
automated
├── pcaps           <!-- network logs -->
└── logs-collected  <!-- application logs -->
-
Open automate/video-groups/video-ids.txt and insert the video IDs of the YouTube videos you want to run. Ensure there are no empty lines at the end of the file. Refer to the provided sample file for the format.
-
Open automate/tcpdump_start.sh and modify Line-7 to specify the network interface that will be used to collect the network logs.
-
Open automate/automate_chrome.sh (or based on the browser preference).
- Line-45 to Line-64 correspond to QUIC-enabled stream.
- Line-66 to Line-82 correspond to QUIC-disabled stream.
You can comment/uncomment appropriate lines based on your requirement.
-
Open automate/run.sh file and modify the following parameters:
- Line-6 sets the number of slots you want to run a video.
- Comment/uncomment/add/remove Lines-9 to Line-11 based on your requirements.
- Choose the browser (Chrome, Chromium, or Firefox) by running the corresponding script (e.g., automate_chrome.sh).
- Select the desired bandwidth pattern (e.g., "dynamic-high.com-", "dynamic-low.com-", "64-256-64-inc.com-") or use one of the provided trace files (located in the mahimahi-trace-files folder).
-
Once you have reviewed and adjusted the input parameters, open the terminal from the automate folder and run the following command to automatically run the setup and collect both application and network logs:
bash run.sh- After running all the videos, you can find the network and application logs inside the pcaps and logs-collected folders, respectively.
Follow these steps to run the experimental setup and manipulate the input parameters to obtain the desired output.
This section provides step-by-step instructions on how to use the application logs to retrieve QoE (Quality of Experience) parameters such as bitrate, avg_bitrate, avg_bitrate_variation, and avg_stall. Follow the steps below:
- Create the following folder hierarchy:
.
├── ...
├── data
│ ├── logFiles
│ │ └── slot
│ │ │ └── dynamic-very-low
│ │ │ │ ├── tcp---tcp_qoe
│ │ │ │ ├── quic---quic_qoe
│ ├── jsonFiles
│ │ └── slot
│ │ │ └── dynamic-very-low
│ │ │ │ ├── tcp---tcp_qoe
│ │ │ │ ├── quic---quic_qoe
│ └── csvFiles
│ │ └── slot
│ │ │ └── 64-256-64-inc
│ │ │ │ ├── tcp---tcp_qoe
│ │ │ │ ├── quic---quic_qoe
└── ...
-
Place the application logs in the logFiles folder and organise them between tcp and quic folders.
-
Open the terminal and run the following command to generate tcp and quic files inside the jsonFiles folder.
python .\scripts\get_json.py slot dynamic-very-low
python .\scripts\dynamic-to-64-256.py
- Run the following command in the terminal to generate both tcp and quic QoE files under the csvFiles folder.
.\create_graphs_slot.bat
NOTE: We have added both tcp and quic QoE files inside the application-logs-qoe collected over 5 geographical locations under dynamic-high, dynamic-low and dynamic-very-low.
Make sure to follow these steps to effectively retrieve the QoE parameters from the application logs.
The raw application and network logs(pcaps) can be found here
