Mode-based morphometry (MBM) is a toolbox for analysing anatomical variations at multiple spatial scales by using the fundamental, resonant modes—eigenmodes—of brain anatomy. The goal is to characterize a group average or group difference at multiple spatial scales by obtaining the spatial frequency spectrum, called beta spectrum, and patterns of its statistical map.
See "Mode-based morphometry: A multiscale approach to mapping human neuroanatomy" for more details.
In this package, we provide the following a main function, demo script to run it, and complement folders:
mbm_main.m: main function to obtain the spatial frequency spectrum, called beta spectrum, the significant pattern, and the most influential modes of the statistical map representing the group average or group difference.mbm_demo_sim.m,mbm_demo_emp.m: demo scripts to runmbm_main.m.mbm_demo_prerequisite.mneeds to be run before running the demos in order to identify the location of input data on your computer.MBM_toolbox.mlapp: app script for GUI of the main function.utils/: dependent packages comprising of gifti-matlab (to read GIFTI file), PALM (to estimate a distribution tail), and fdr_bh (to use FDR correction).data/: demo data to run the demo codes.func/: functions used in the main code for analysis and visualization.figure/: figures
Download the repository. If you already have the packages in utils and would like to use yours, modify the paths in MBM_toolbox.mlapp and mbm_main.m to point to them.
Read the comments and documentation within each code for usage guidance.
Due to the file size exceeding the limit allowed by GitHub, you will need to fill the data/ directories with data that you can download from this OSF repository. The total file size is 2 GB.
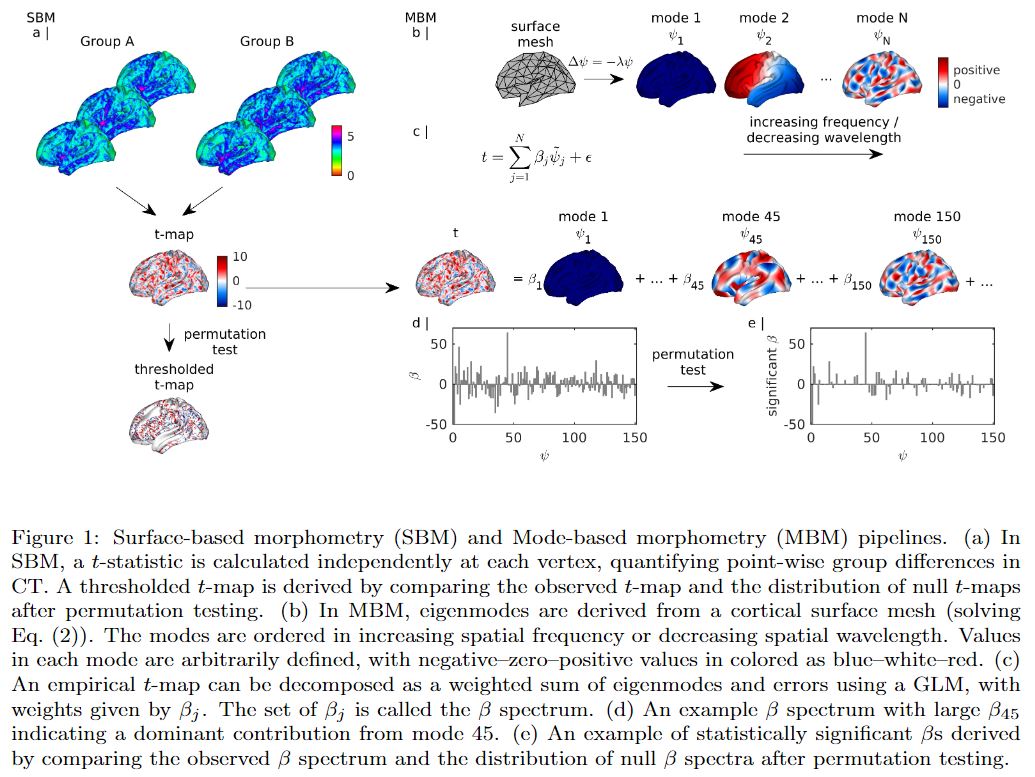
mbm_main.m executes the pipelines in Fig. 1. The inputs to mbm_main.m combined in a Matlab structure named MBM are:
-
A path to anatomical maps to be analysed and a path to a mask to exclude elements of the maps from the analysis. Anatomical maps are expected as GIFTI, NIFTI, or .mgh files and projected on an average surface. In the example given in
mbm_demo_sim.m, the left fsaverage midthickness surface with 32492 vertices is used as an average template. -
Parameters specifying the statistical test and a design matrix representing effects on subjects. One-sample t-test, two-sample t-test, one-way ANOVA, and ANCOVA (two groups) are supported.
-
The eigenmodes (ψj in Fig. 1) or a surface mesh (a .vtk file) to calculate the eigenmodes. Eigenmodes should be derived from the same average surface that the maps are projected on.
-
Parameters specifying the visualisation of the results.
The outputs of mbm_main.m combined in the structure MBM are: the statistical map, its p-values, thresholded statistical map, beta spectrum, its p-values, significant beta spectrum, the significant patterns, and the most influential modes. Visualisation of the results is provided.
Run help mbm_main in the Command Window or open mbm_main.m to see the documentation on all the input and output parameters and their types. See mbm_demo_sim.m and mbm_demo_emp.m for examples.
To use the GUI in Matlab, open MBM_toolbox.mlapp by double clicking.
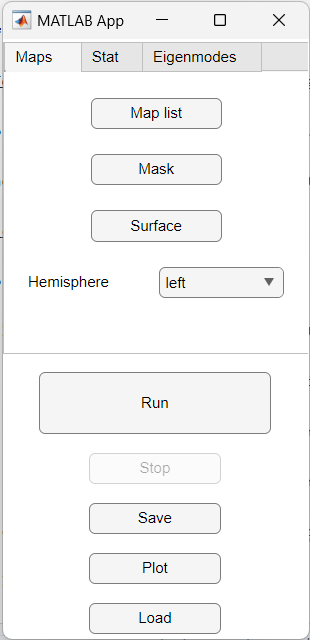
The app appears as shown below. On the upper part, the input panel has three tabs: Maps, Stat, and Eigenmodes. The run panel is on the lower part.
Load the following inputs to run the model:
-
In the Maps tab:
-
Map list: a text file comprising the list of paths to the anatomical maps in GIFTI, NIFTI, or .mgh format; or a .mat file containing a matrix whose each row is a map; or a .mgh file containing a 4-D matrix obtained mri_glmgit output.
-
Mask: a text file containing a binary mask where values '1' or '0' indicate the vertices of the applied maps to be used or removed.
-
Surface: a vtk file containing a surface used to calculate the eigenmodes and/or plot the results. The surface should be the one that the eigenmodes are derived from and the anatomical maps are projected on.
-
Hemisphere: to be analysed, chosen from the drop down list.
-
-
In the Stat tab:
-
Statistic test: chosen from the drop down list.
-
design matrix G: a text file containing a design matrix [m subjects by k effects]. For the design matrix in the statistical test of one sample (one column), two sample (two columns), one way ANOVA (k columns, number of subjects in each group must be equal), '1' or '0' in each column indicates a subject in a group or not. For the design matrix in the statistical test of ANCOVA: '1' or another number (e.g., '2') in the first column indicates the group effect (similar to the input file for mri_glmfit in Freesurfer) and discrete or continuous numbers in the second to k-th columns indicates covariates.
-
Permutation: the number of permutations in the statistical test.
-
Pthr: tail approx: the threshold of p-values for tail approximation. If the p-values are below Pthr, these are refined further using a tail approximation from the Generalise Pareto Distribution (GPD).
-
P threshold: the threshold of p-values for being significant.
-
FDR: mark if using FDR correction.
-
-
In the Eigenmodes tab,
-
Eigenmodes: a text file or a .mat file containing eigenmodes in columns. If you do not have pre-calculated eigenmodes, this input can be omitted but .vtk surface is required. The code will calculate the eigenmodes from the .vtk surface.
-
Mass matrix: a text file or a .mat file containing mass matrix. See https://github.com/Deep-MI/LaPy and the reference papers to understand what is a mass matrix and how eigenmodes are calculated.
-
Number of modes: the number of eigenmodes used for the analysis.
-
Most influential modes: the number of the most influential modes to plot.
-
On the lower part:
- Run: to run the analysis.
- Save: to save the structure 'MBM' containing the parameters and results in a .mat file when the analysis has finished.
- Plot to plot the results. The result panel comprises the t-map, the thresholded t-map, the beta spectrum, the significant pattern, and most influential modes.
- If required, press Stop to interupt the analysis. For 5000 permutations, the analysis needs approximately one hour to run.
Run mbm_demo_prerequisite.m to generate the paths to input data on your computer. This has to be run before the following demos.
Run mbm_demo_sim.m for mapping cortical thickness difference, i.e., two sample t-test, on simulated data.
Run mbm_demo_emp.m for mapping cortical thickness difference taking into account covariate of sex and age, i.e., ANCOVA, on empirical data.
Note that mbm_demo_prerequisite.m has to be run as a prerequisite.
If mbm_demo_sim.m or mbm_demo_emp.m has been run, use "Load" button to read 'data/demo_sim/mbm_demo_sim.mat' or 'data/demo_sim/mbm_demo_emp.mat'. Hit "Run" button to run and "Plot" to plot the results.
Otherwise, load all the inputs in the tabs on the upper part and then hit "Run". Use the example data as described below.
In demo_sim and demo_emp folders:
-
Input thickness maps are in the thickness folder.
-
inputMaps_full_path.txt,inputMaps_full_path_ANCOVA_twosample.txt, orinputMaps_full_path_onewayANOVA.txt: containing the list of paths to input maps.mbm_demo_prerequisite.mneeds to be run before running the demos in order to generate these files from the list of input maps ininputMaps_filename.txt,inputMaps_full_path_ANCOVA_twosample.txt, orinputMaps_filename_onewayANOVA.txt. -
inputMaps_ANCOVA_twosample.mat: containing a matrix whose each row is a map. -
inputMaps_ANCOVA_twosample.mgh: containing a 4-D matrix obtained as mri_glmgit output. -
mask_S1200.L.midthickness_MSMAll.32k_fs_LR.txtorfsaverage_164k_cortex-lh_mask.txt: binary mask. -
fsLR_32k_midthickness-lh.vtkorfsaverage_164k_midthickness-lh.vtk: the vtk file of the surface. -
G_one_sample.txt,G_onewayANOVA_twosample.txt,G_onewayANOVA_twosample.csv,G_two_sample.txt,G_one_way_ANOVA.txt, orG_ANCOVA.txt: the design matrix G corresponding to the statistical test. -
fsLR_32k_midthickness-lh_emode_150.mat,fsLR_32k_midthickness-lh_emode_150.txt, orfsaverage_164k_midthickness-lh_emode_200.mat: the eigenmodes. -
fsLR_32k_midthickness-lh_mass_150.mat,fsLR_32k_midthickness-lh_mass_150.txt, orfsaverage_164k_midthickness-lh_mass_200.mat: the mass matrix.
Original empirical data are from the Human Connectome Project and HCP Early Psychosis (HCP-EP). Please consult the link for detailed information about access, licensing, and terms and conditions of usage.
Useful functions relating to eigenmodes may be found at https://github.com/NSBLab/BrainEigenmodes/tree/main
The codes run on versions of MATLAB from R2022a to R2024a.
If you use our code in your research, please cite us as follows:
Trang Cao, James C. Pang, Ashlea Segal, Yu-Chi Chen, Kevin M. Aquino, Michael Breakspear, Alex Fornito, Mode-based morphometry: A multiscale approach to mapping human neuroanatomy, (DOI: 10.1002/hbm.26640)
Please contact trang.cao@monash.edu if you need any further details.

