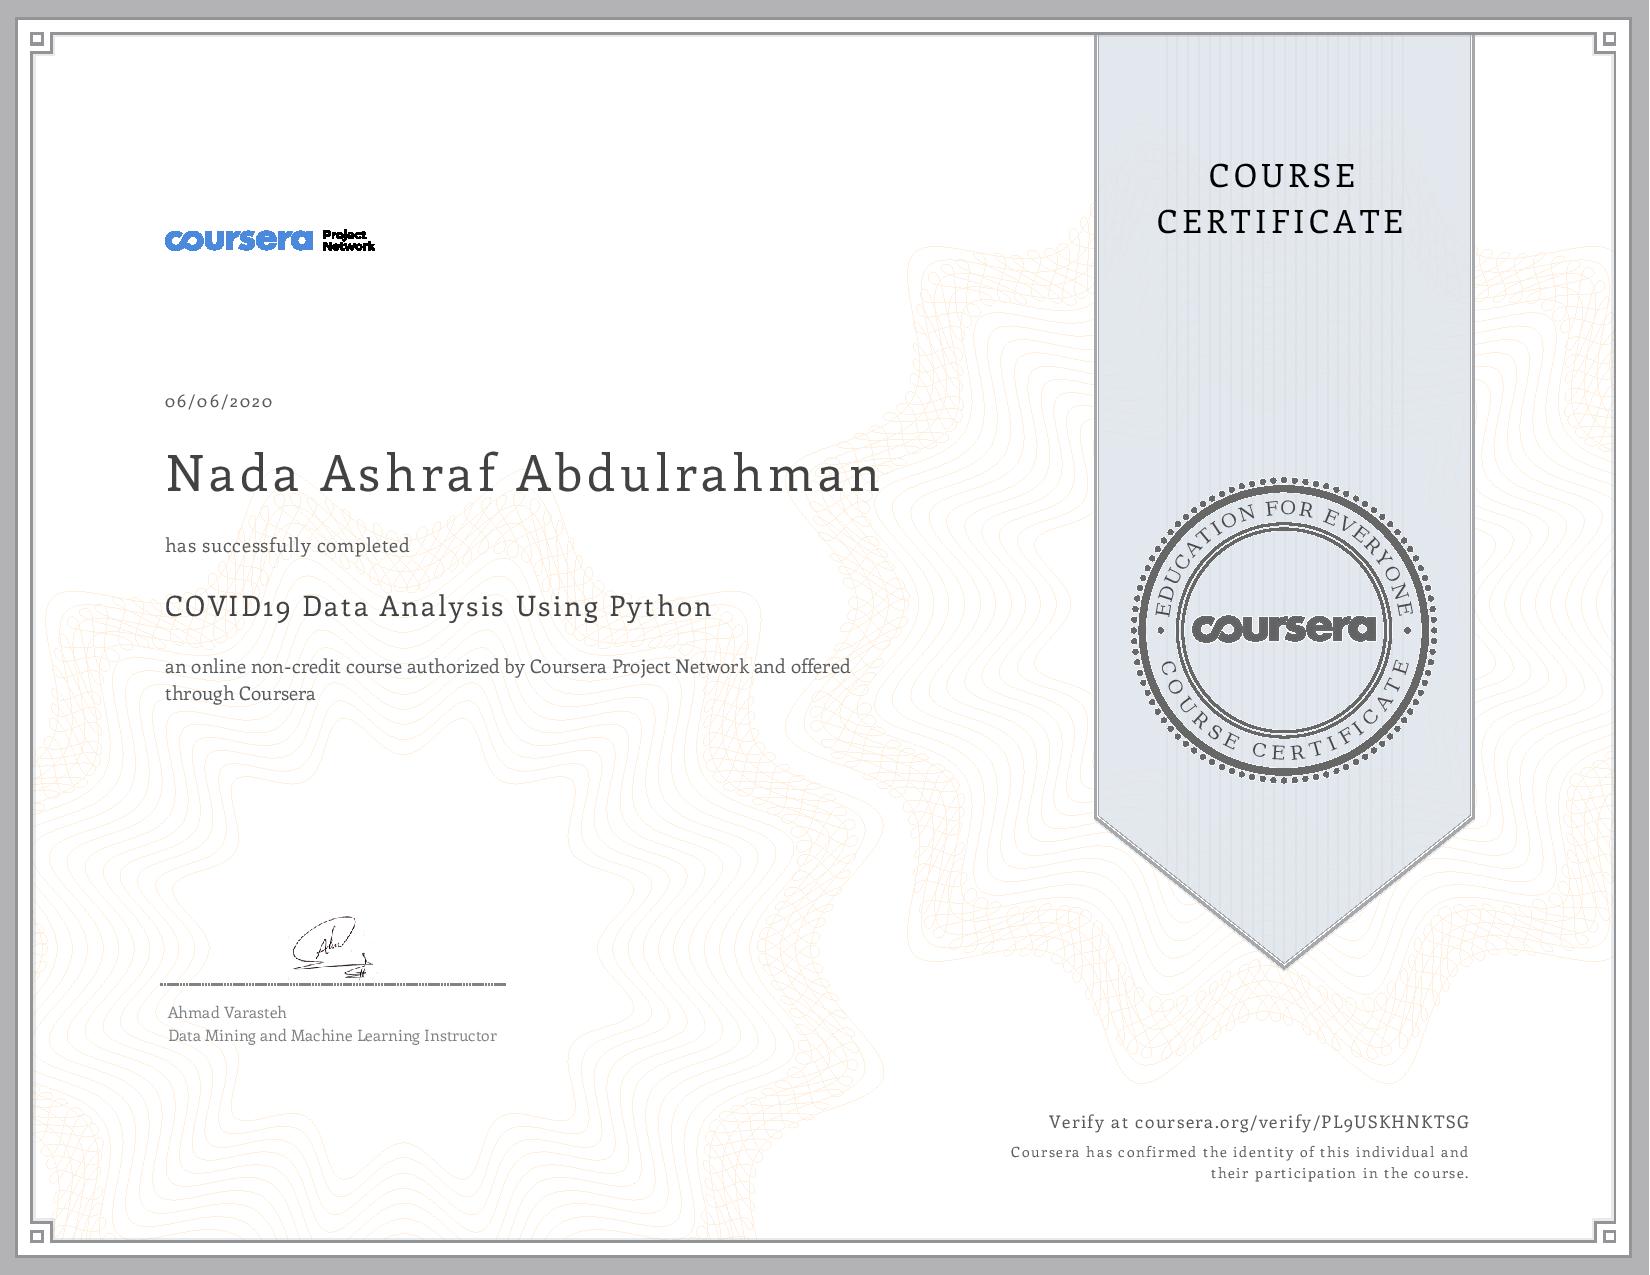
This project is a projec-based course from Coursera. In this project, I will preprocess and merge datasets to calculate needed measures and prepare them for an Analysis. I'm going to work with COVID19 dataset, published by John Hopkins University, which consist of the data related to cumulative number of confirmed cases, per day, in each Country. Also I will work on another dataset consist of various life factors, scored by the people living in each country around the globe.I'm going going to merge these two datasets to see if there is any relationship between the spread of the the virus in a country and how happy people are, living in that country.
The hands on project on COVID19 Data Analysis using Python is divided into following tasks:
Understand the purpose of the project, the datasets that will be used, and the question we will answer with our analysis.
Import COVID19 dataset and prepare it for the analysis by dropping columns and aggregating rows.
Decide on and calculate a good measure for our analysis.
Import World happiness report dataset, dropping useless columns and Merge it with COVID19 dataset to find correlations among our data.
Visualize our results using Seaborn.
The analysis shows that people in developed countries are more prone to getting the infection.
