What will you learn?
-
Web scraping to gain company insights: Scrape and analyse customer review data to uncover findings for British Airways
-
Predicting customer buying behaviour: Build a predictive model to understand factors that influence buying behaviour
Here is your task
The first thing to do will be to scrape review data from the web. For this, you should use a website called Skytrax.
The team leader wants you to focus on reviews specifically about the airline itself. You should collect as much data as you can in order to improve the output of your analysis. To get started with the data collection, you can use the “Jupyter Notebook” in the Resources section below to run some Python code that will help to collect some data.
Once you have your dataset, you need to prepare it. The data will be very messy and contain purely text. You will need to perform data cleaning in order to prepare the data for analysis. When the data is clean, you should perform your own analysis to uncover some insights. As a starting point, you could look at topic modelling, sentiment analysis or wordclouds to provide some insight into the content of the reviews. It is recommended to complete this task using Python, however, you can use any tool that you wish. You can use some of the documentation websites provided in the Resources section below to analyse the data.
Please ensure that you have created a folder called "data" and mapped your file path.
Your manager would like you to summarise your findings within a single PowerPoint slide, so that they can present the results at the next board meeting. You should create visualisations and metrics to include within this slide, as well as clear and concise explanations in order to quickly provide the key points from your analysis. Use the “PowerPoint Template” provided to complete the slide.
First, spend some time exploring the dataset in the “Getting Started” Jupyter Notebook provided in the Resources section below to understand the different columns and some basic statistics of the dataset. Then, you should consider how to prepare the dataset for a predictive model. You should think about any new features you want to create in order to make your model even better. You can make use of the Resources provided to get you started with this task.
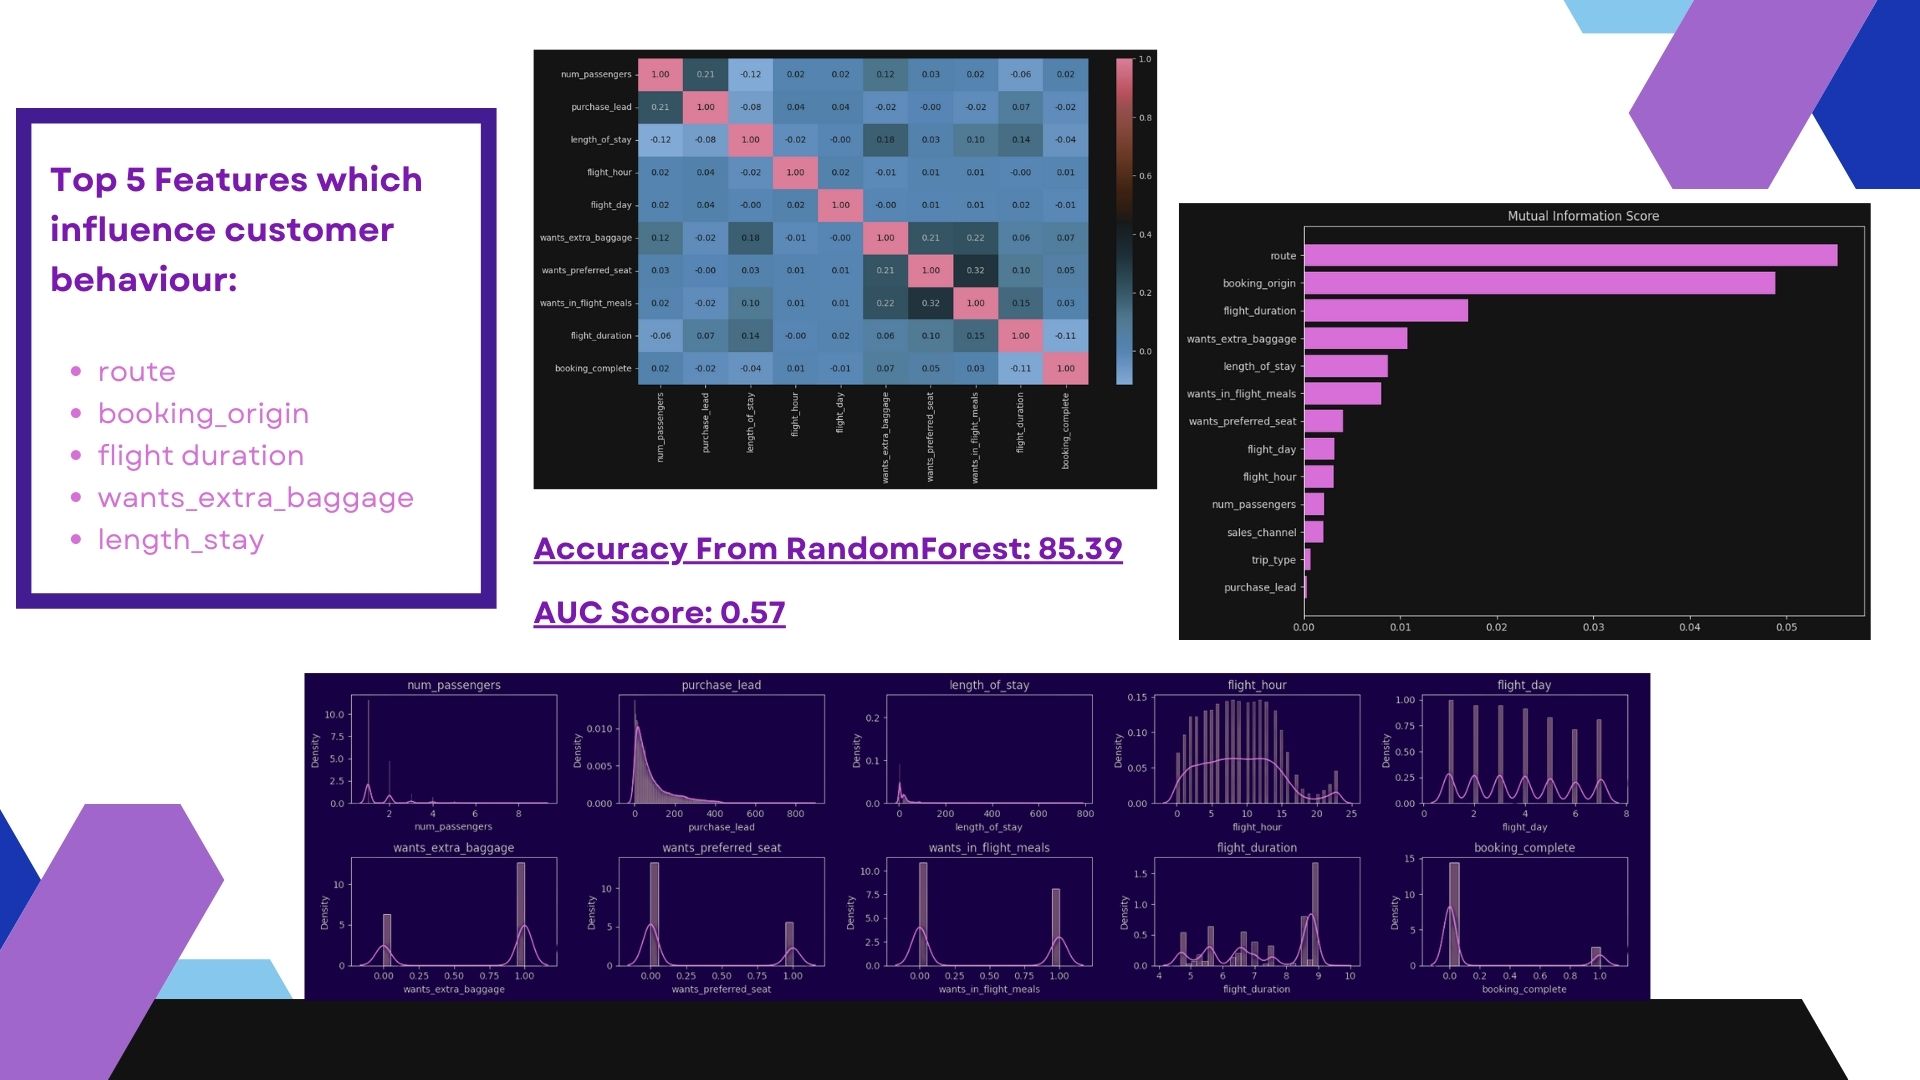
When your data is ready for modelling, you should train a machine learning model to be able to predict the target outcome, which is a customer making a booking. For this task, you should use an algorithm that easily allows you to output information about how each variable within the model contributes to its predictive power. For example, a RandomForest is very good for this purpose.
After training your model, you should evaluate how well it performed by conducting cross-validation and outputting appropriate evaluation metrics. Furthermore, you should create a visualisation to interpret how each variable contributed to the model. Finally, you should summarise your findings in a single slide to be sent to your manager. Use the “PowerPoint Template” provided in the Resources section below to create your summary and make use of the links provided to help with this task.

