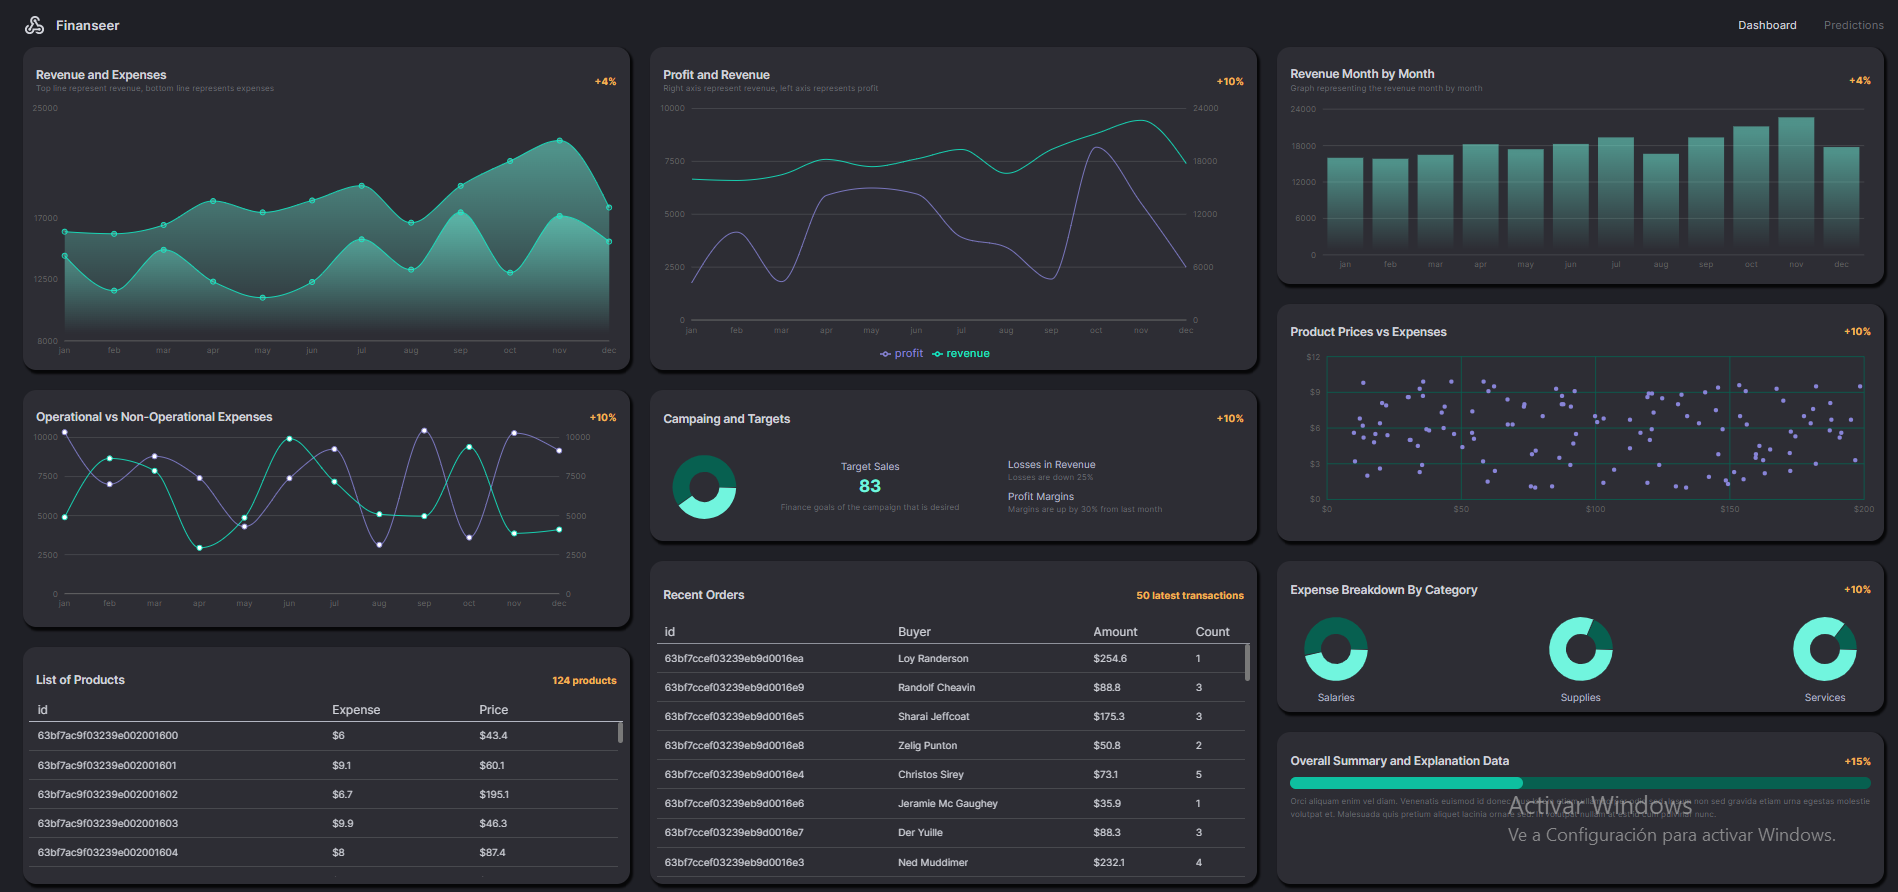
In this repository, you will find 2 routes:
- The first is a dashboard panel with analytics, graphs, and tables.
- The second is a table with business predictions made using the regressionJS library.
✅ FINISHED ✅
The first route is a panel that displays various metrics, analytics, and tables that show information about a business. This panel provides a comprehensive overview of the business's performance and helps stakeholders make data-driven decisions.
The second route is a graph that shows a linear regression based on data from a specified year. The linear regression was generated using the regressionJS library, which utilizes AI. With this linear regression, the application makes a prediction for the next year based on the trend observed in the data. This feature enables business owners to forecast their performance and plan accordingly.
Overall, this project provides a comprehensive solution for businesses looking to analyze their data and make informed decisions.
- TypeScript
- React
- Redux Toolkit
- Redux Toolkit Query
- Recharts
- React Router Dom
- RegressionJS
- Material UI
- ViteJS
- NodeJs
- ExpressJs
- MongoDB
- Mongoose
- Helmet
- Cors
- Dotenv
- Morgan
- BodyParser
