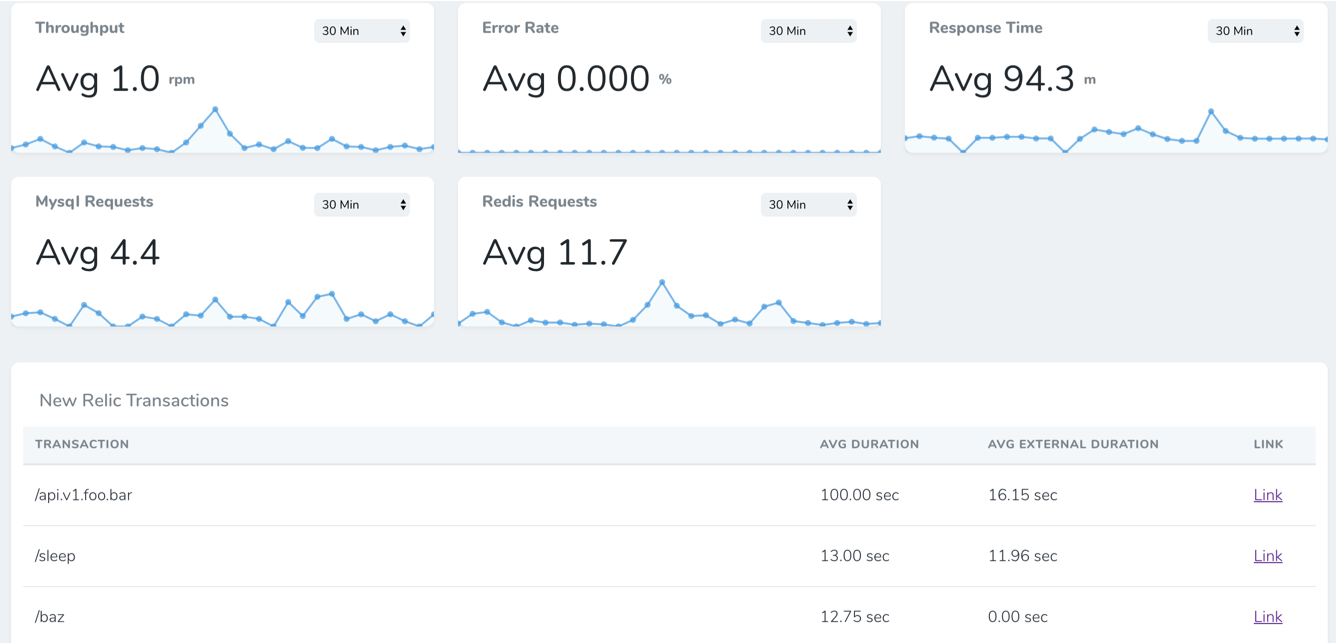
Add Error Rate, Throughput and Response Time metrics to your Laravel Nova Dashboard.
You need to run the following command:
composer require napp/nova-new-relic-metrics
add the following to config/services.php
'newrelic' => [
    'api_key' => env('NEW_RELIC_API_KEY'),
    'insights_api_key' => env('NEW_RELIC_INSIGHTS_API_KEY'),
    'account_id' => env('NEW_RELIC_ACCOUNT_ID'),
    'app_id' => env('NEW_RELIC_APP_ID'),
]add to NovaServiceProvider.php
public function cards()
{
    return [
        new \Napp\NewRelicMetrics\Metrics\Throughput,
        new \Napp\NewRelicMetrics\Metrics\ErrorRate,
        new \Napp\NewRelicMetrics\Metrics\ResponseTime,
        new \Napp\NewRelicMetrics\Metrics\MysqlRequests,
        new \Napp\NewRelicMetrics\Metrics\RedisRequests,
        new \Napp\NewRelicMetrics\TransactionsCard,
    ];
}