Global corporations rely on intricate supply chain management, facing disruptions every few years, causing potential substantial earnings loss. Complete supply chain visibility is crucial for control, bottleneck identification, and understanding suppliers. While traditional databases struggle with complex queries, graph databases excel in visualizing interconnected data, enhancing comprehension of relationships.
This guide demonstrates leveraging a graph database, like Neo4j, to visualize supply chain interrelationships where users can explore and identify direct and indirect links between products, components, or suppliers.
For this project, we consider a fictitious automotive manufacturing company that builds various car types and models. We go through how to visualize and analyze the supply chain for this company for various use cases using Graphs (Neo4j) using the Cypher query language.
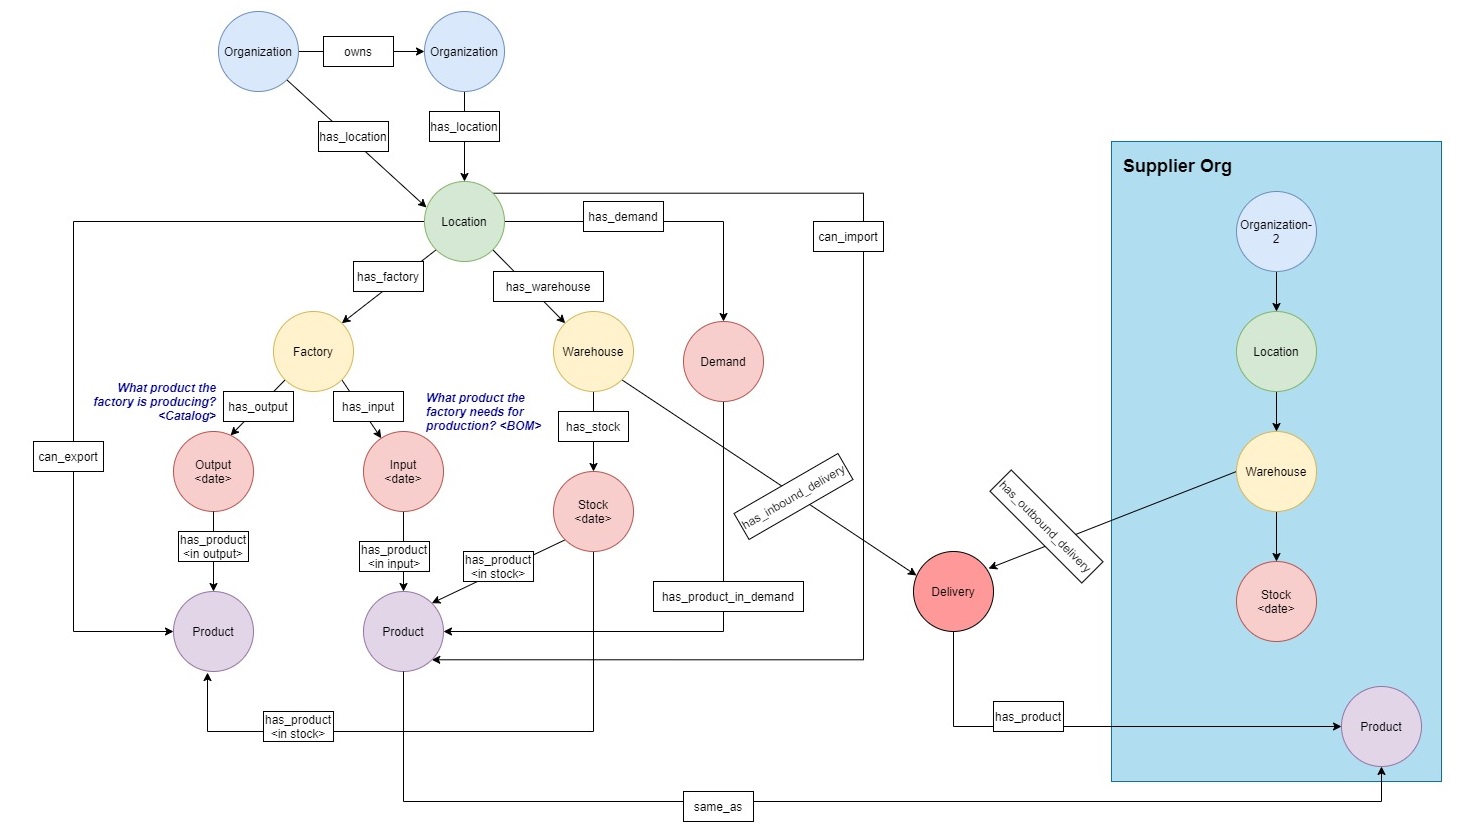
The following diagram provides a high-level overview of how the various components of this fictitious car manufacturing company are related to each other. This provides an overview how the supplier organization and subsidiaries are related with the company, the locations where the factories and warehouses are operating, the various products required to build the car, and how they’re related to demand.
Generally, a car manufacturing company might have the following different data types:
- Organizational data containing documentation, processes, facilities, hierarchies, systems and databases, and more
- Product data containing product details or bill of materials (BoM)
- Customer data containing CRM, corporate data, and so on
- Third-party data like dealer data, social media, and market data
- Event data like telematics data, customer connect, or warranty information
- Supply chain data like supplier data, inventory data, or logistics data For this project, we use data related to inventory, BoM, facilities, and hierarchies.
- Docker Desktop
- Python 3.9 or higher
- Knowledge of Cypher and Jupyter notebooks.
In this section, we create the fictitious data required for analysis.
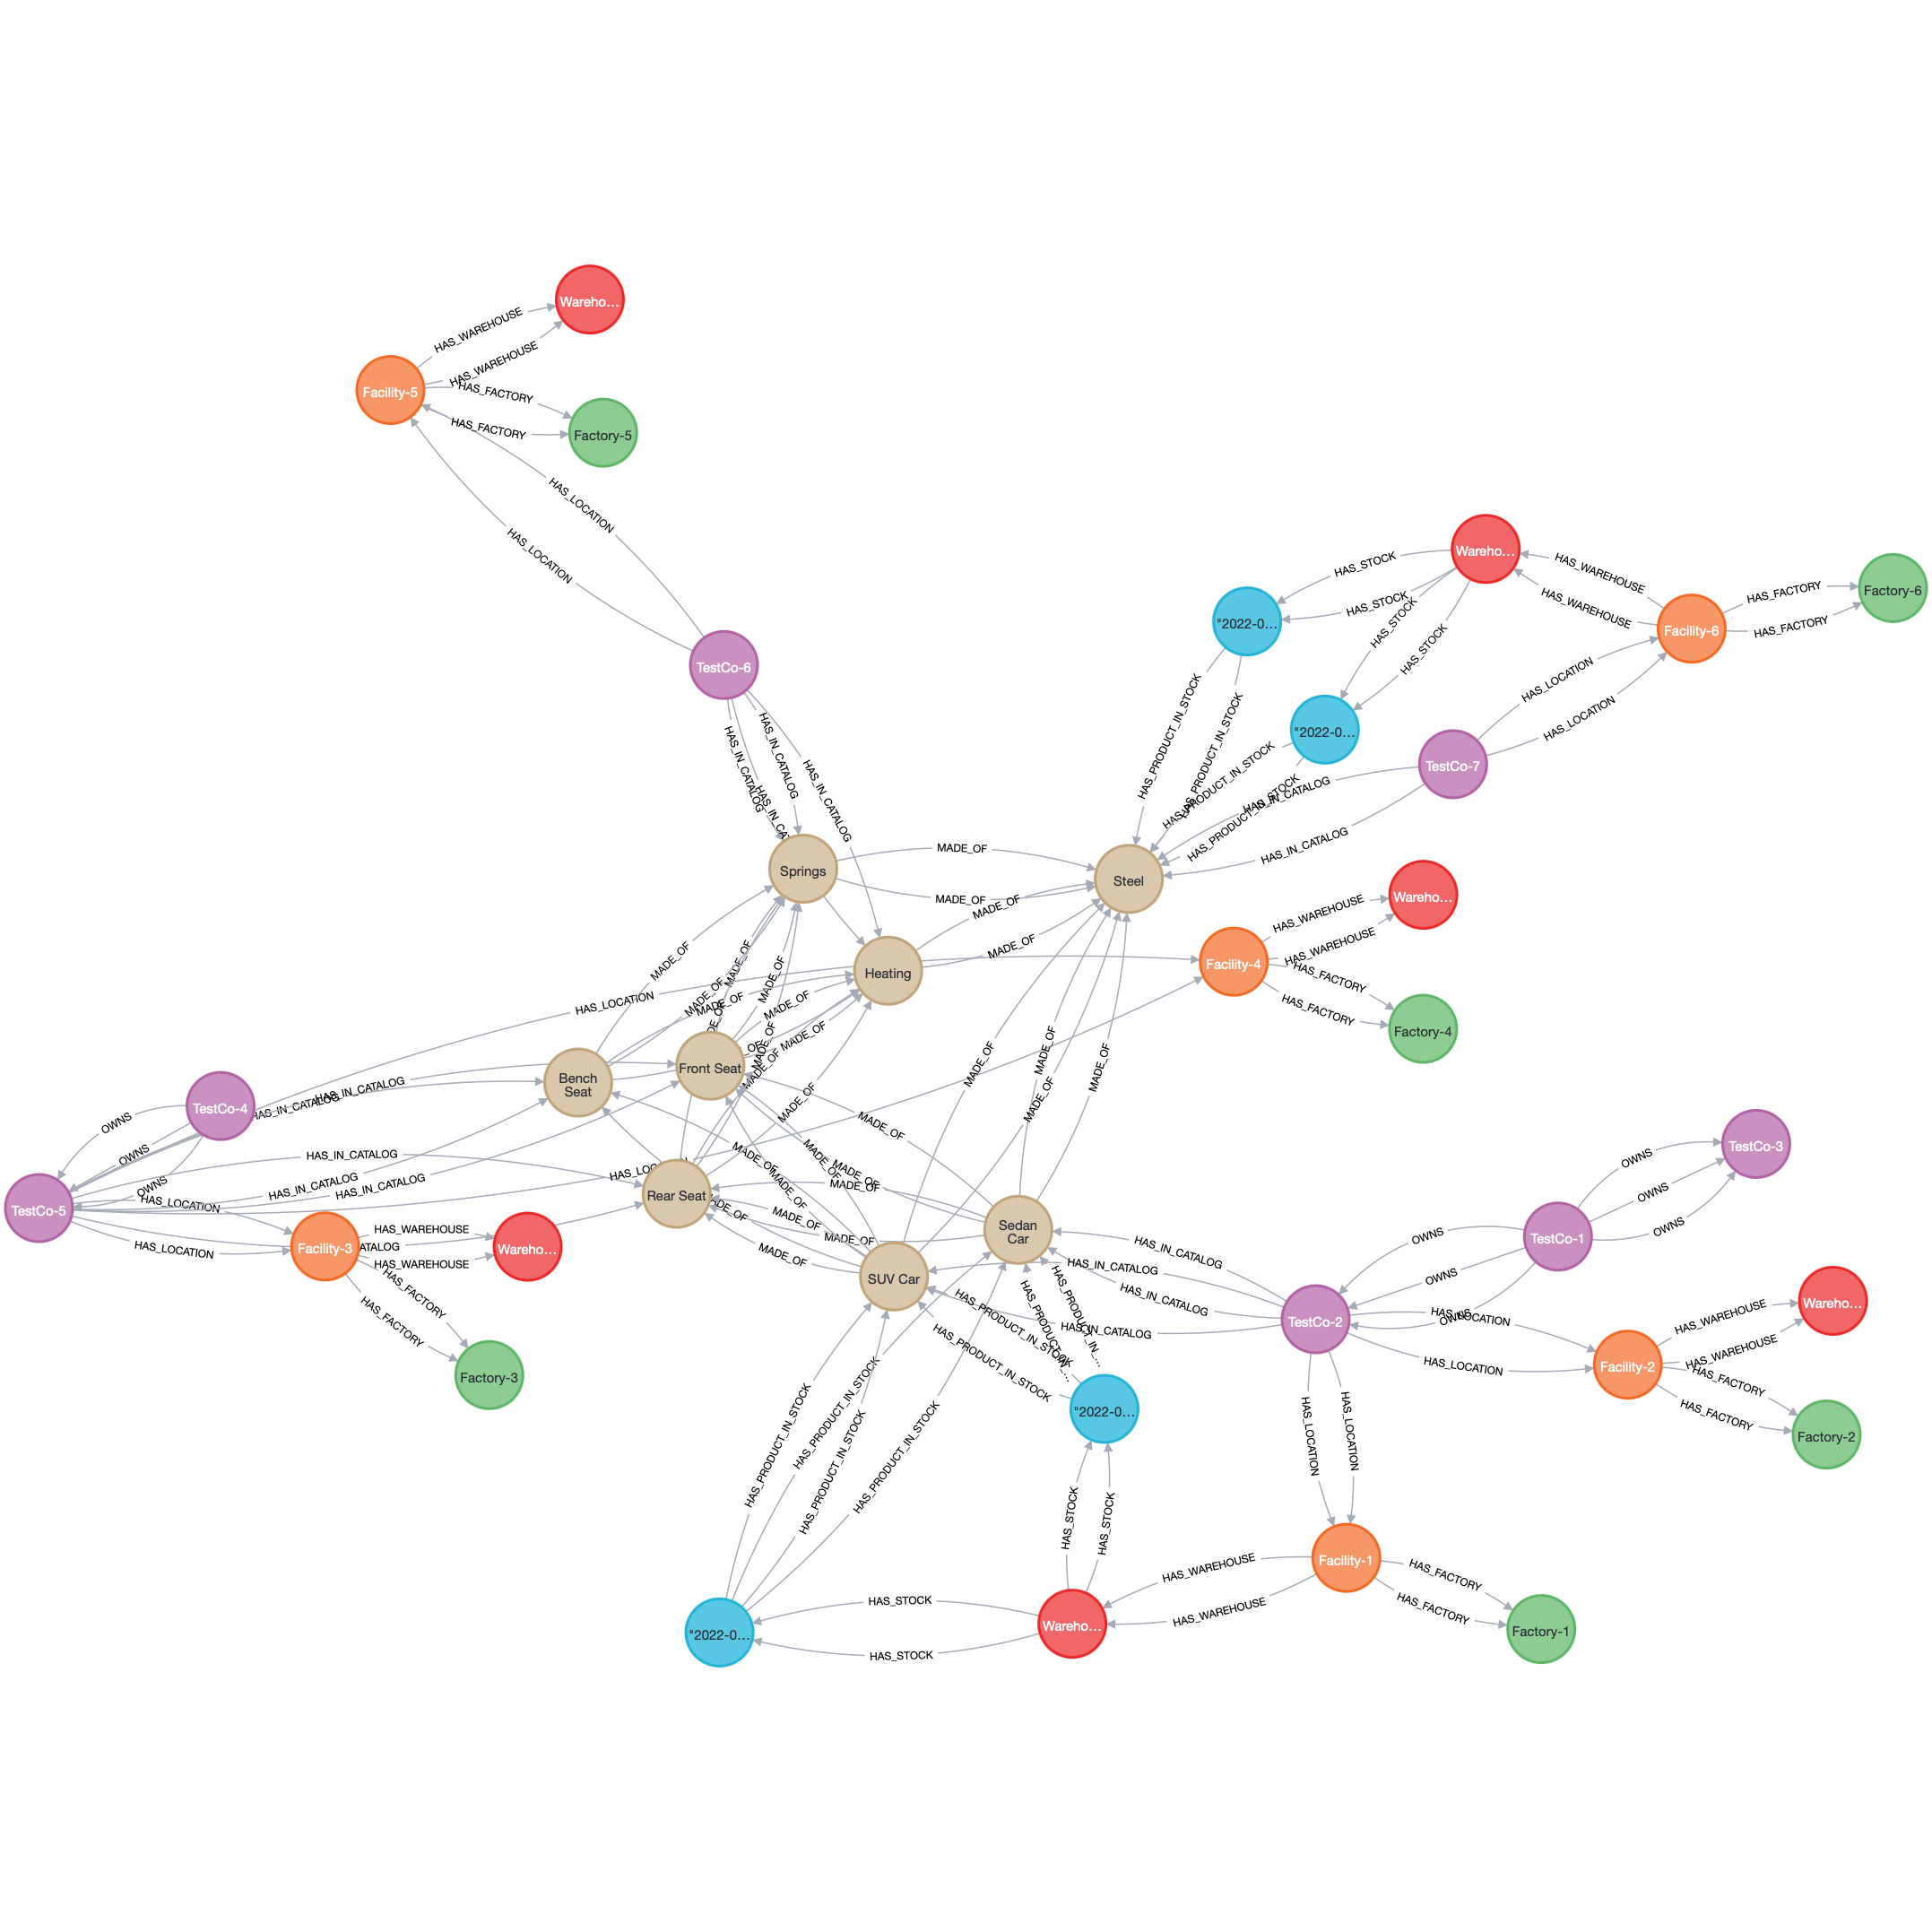
- Seven companies with names as TestCo-*.
- Various facilities, warehouses, and factories required for the analysis.
- We consider various types of cars like sedans and roadsters, and various components of the car like the front seat, rear seat, heating, springs, steel, and more.
Code for creating the database is available in the create_database.ipynb notebook.
Followed steps:
- Create the various companies, suppliers, and subsidiaries
- Add the locations, warehouses, factories, products, and stock information
- Verify the number of companies created (it should be seven)
- Verify the total number of products created (it should be eight)
- Add the company ownership structure (Moved to data-analysis notebook)
- Create relationships between factories, warehouses, products, and stock (Moved to data-analysis notebook)
In this section, we traverse the supply chain graph for the fictitious automotive company created in the preceding sections and start to get some actionable KPIs. We’re interested in the following:
- The bill of materials (BOM) for a car
- The various components the car is made of
- The stock for a certain car type in all the warehouses
- Clone the repository
- Run
docker-compose upto start the Neo4j database Neo4j will be available at http://localhost:7474 - Run
pip install -r requirements.txtto install the required Python packages - Run
jupyter notebookto start the Jupyter notebook server
Neo4j: https://neo4j.com/ Cypher: https://neo4j.com/developer/cypher/

