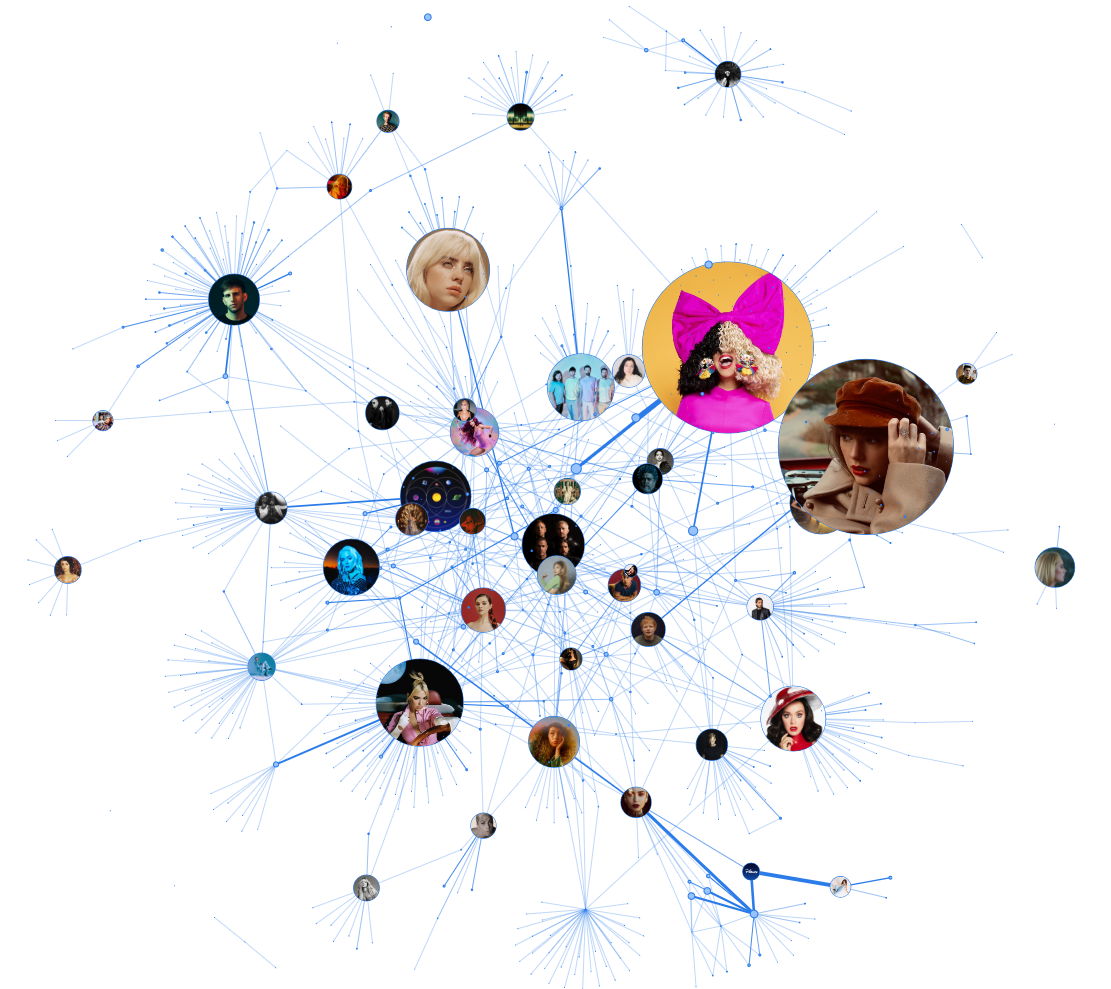
Graphical representation of your favorite playlist! Generate a graph, which shows how many songs of an artist you have added (size of a node), and visualize every song that two artists had recorded together (size of an edge). It looks very cool, doesn’t it? So go ahead, and visualize your playlist!
Input your data in .env file:
TOKEN=YOUR_TOKEN_FROM_SPOTIFY_API
PLAYLIST=ID_OF_PLAYLIST
You can get your token here: Spotify API. Just click "Get Token". If you want to visualize a private playlist, please select an adequate scope. Your token should start with "BQ".
You can see your playlist ID by clicking Share > Copy Link To PLaylist. Your ID will be visible in the URL. (Example: 5xynfyTPMhpWEVq91TwNQz)
Required libraries:
- pyvis
pip install pyvis
Then just run the python script:
python main.py
If the playlist is big, it may take some time, cause not to exceed rate limits every request has a 1s cooldown (which can be easily changed)
