Python package to create 2D geometries.
Clone this repository and copy the pygeom directory where you are going to write your Python scripts or your Jupyter notebooks. Then you can simply import the module.
import pygeomYou will find many more examples in the notebook sub-directory of this repo.
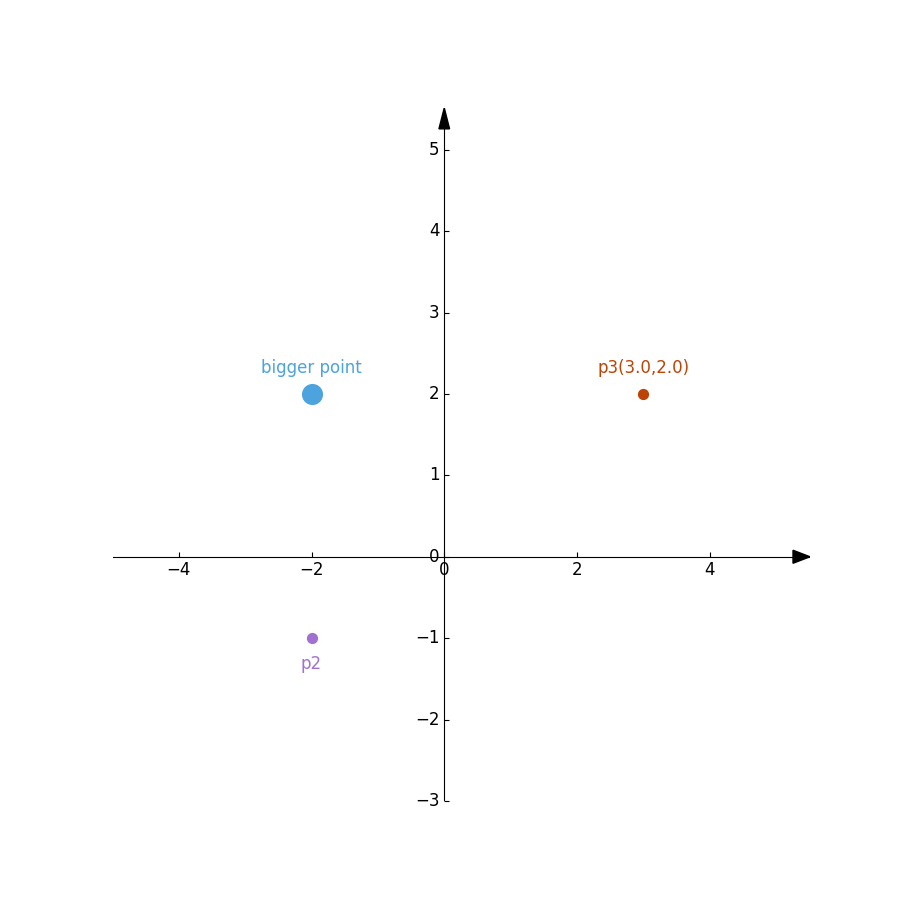
# Create the cartesian axis
axes = Axes(xlim=(-5,5), ylim=(-3,5), figsize=(9,9))

p1 = Point(-2,  2, size=200, label='bigger point')
p2 = Point(-2, -1, color='#a270d1', label='p2', loc='down')
p3 = Point( 3,  2, color='#bb4406', label='p3', coords=True)

axes.add(p1)
axes.addMany([p2, p3])
axes.draw()# Create the cartesian axis
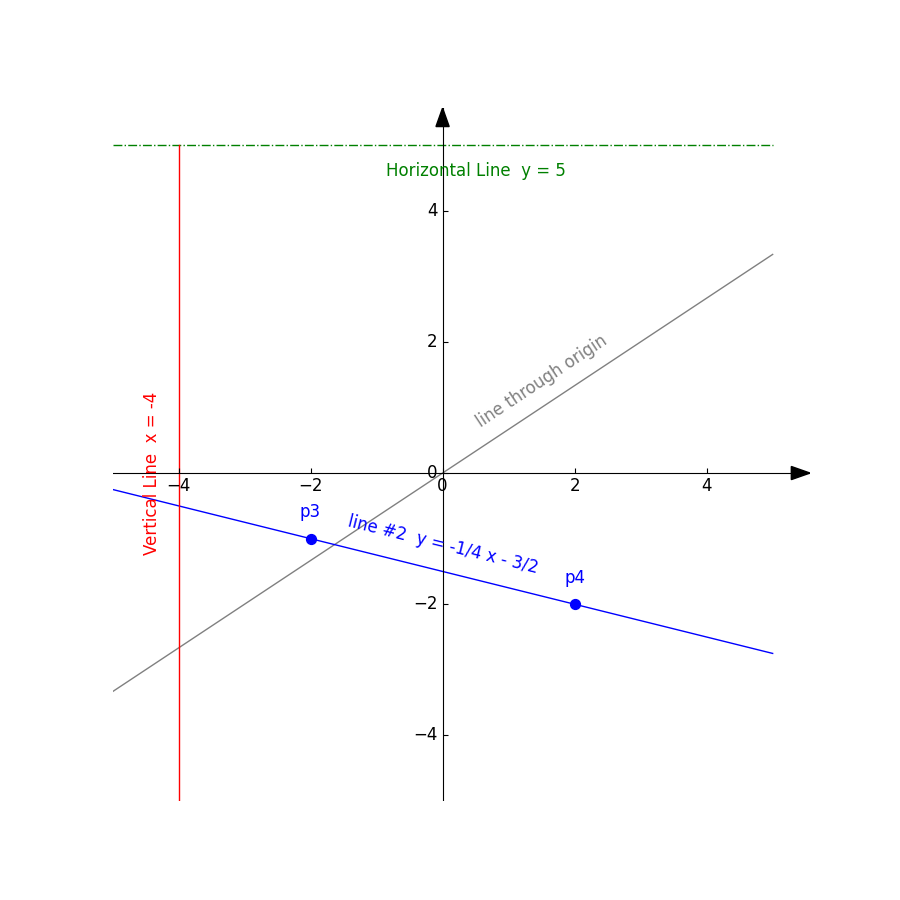
axes = Axes(xlim=(-5,5), ylim=(-5,5), figsize=(9,9))
# A grey line between two points p1 and p2
l1 = Line(
p1=Point(0, 0),
p2=Point(3, 2),
label='line through origin',
color='grey'
)
axes.add(l1)
# A blue line between two points p3 and p4, this time give the points a label
p3 = Point(-2, -1, color='blue', label='p3')
p4 = Point( 2, -2, color='blue', label='p4')
l2 = Line(
p1=p3,
p2=p4,
label='line #2',
add_eq=True,
color='blue'
)
axes.addMany([p3, p4, l2])
# This time define a green line with a slope and intercept
l3 = Line(
slope=0.0,
intercept=5.0,
label='Horizontal Line',
loc='down',
add_eq=True,
color='green',
linestyle='dashdot'
)
axes.add(l3)
# vertical line
l4 = Line(
p1=Point(-4, -2),
p2=Point(-4, 2),
color='red',
add_eq=True,
label='Vertical Line',
loc='left'
)
axes.add(l4)
axes.draw()import math
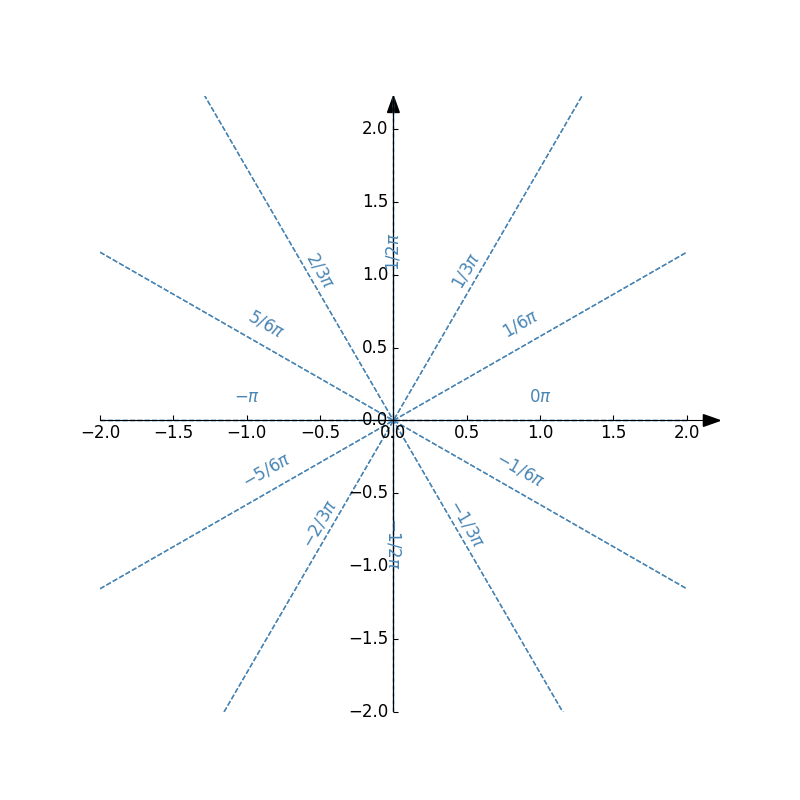
# Create the cartesian axis
axes = Axes(xlim=(-2,2), ylim=(-2,2), figsize=(8,8))
# Multiples of pi to test
multiples = {
'-' : -1,
'-5/6': -5/6,
'-2/3': -2/3,
'-1/2': -1/2,
'-1/3': -1/3,
'-1/6': -1/6,
'0' : 0,
'1/6' : 1/6,
'1/3' : 1/3,
'1/2' : 1/2,
'2/3' : 2/3,
'5/6' : 5/6
}
for v_sting, v_float in multiples.items():
theta = v_float*math.pi
p1 = Point(0,0)
p2 = Point(2*math.cos(theta), 2*math.sin(theta))
line = Line(
p1=p1,
p2=p2,
label='$%s\pi$' % (v_sting),
color='#4885b4',
linestyle='dashed'
)
axes.add(line)
axes.draw('./img/tutorial02-lines-angles.png')import math
import numpy as np
from pygeom import Axes, Point, Curve
def f(x):
y = math.pow(x, 2)
return y
def g(x):
if x < 0:
y = np.nan
else:
y = math.sqrt(x)
return y
def h(x):
y = 1/x
return y
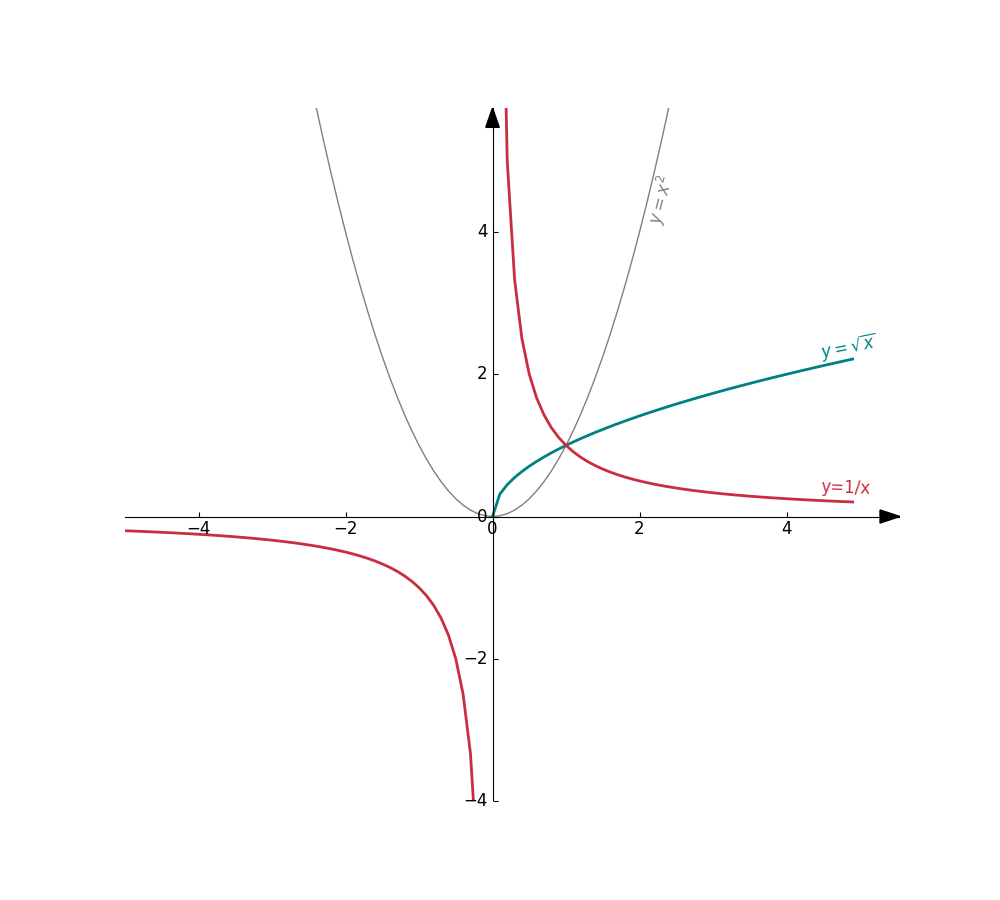
# Create the cartesian axis
axes = Axes(xlim=(-5,5), ylim=(-4,5.2), figsize=(10,9))
# Curve of y = x^2
c1 = Curve(f, label=r'$y=x^2$', color='grey')
axes.add(c1)
# Curve of y = sqrt(x)
c2 = Curve(g, label=r'$y=\sqrt{x}$', linewidth=2, color='#008080')
axes.add(c2)
# Curve of y = 1/x
c3 = Curve(h, x_disc=[0.0], label='y=1/x', linewidth=2, color='#ca2c40')
axes.add(c3)
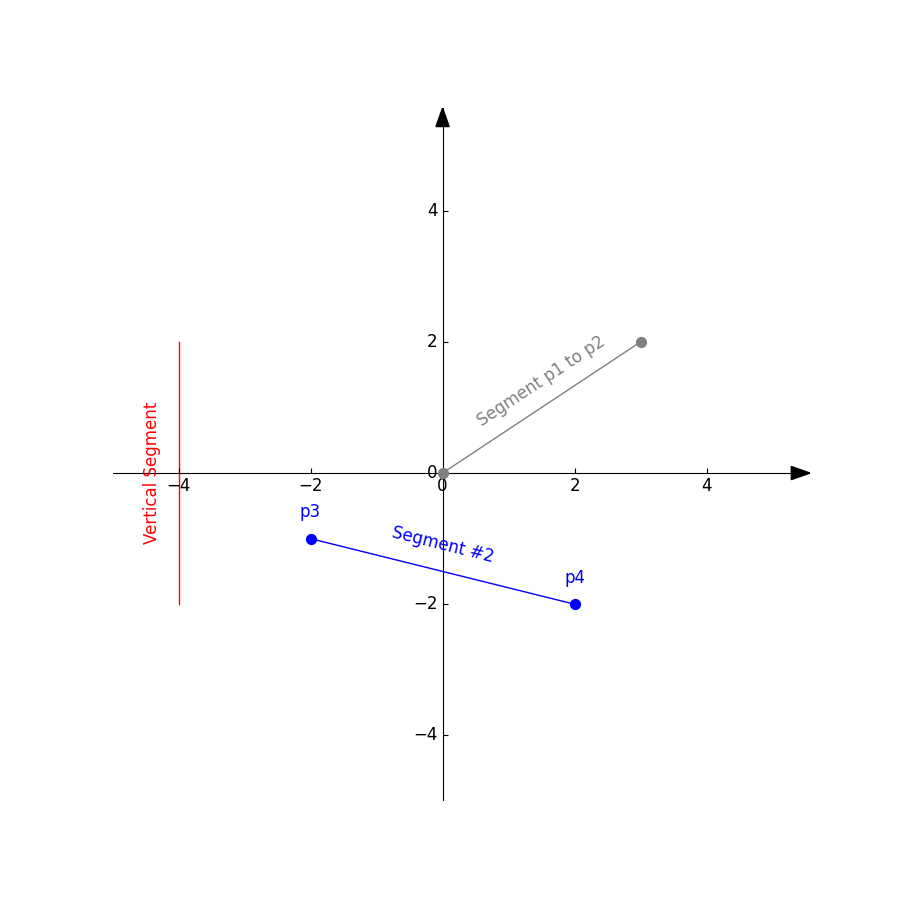
axes.draw()# Create the cartesian axis
axes = Axes(xlim=(-5,5), ylim=(-5,5), figsize=(9,9))
# A grey segment between two points p1 and p2
p1 = Point(0, 0, color='grey')
p2 = Point(3, 2, color='grey')
s1 = Segment(p1=p1, p2=p2, label='Segment p1 to p2', color='grey')
axes.addMany([p1, p2, s1])
# A blue segment between two points p3 and p4
p3 = Point(-2, -1, color='blue', label='p3')
p4 = Point( 2, -2, color='blue', label='p4')
s2 = Segment(p1=p3, p2=p4, label='Segment #2', color='blue')
axes.addMany([p3, p4, s2])
# A vertical segment
s3 = Segment(
p1=Point(-4, -2),
p2=Point(-4, 2),
color='red',
label='Vertical Segment',
loc='left'
)
axes.add(s3)
axes.draw('img/tutorial05-segments.png')