In this recruiting competition, job-seekers are provided with historical sales data for 45 Walmart stores located in different regions. Each store contains many departments, and participants must project the sales for each department in each store. To add to the challenge, selected holiday markdown events are included in the dataset. These markdowns are known to affect sales, but it is challenging to predict which departments are affected and the extent of the impact.
stores.csv
features.csv
train.csv
sampleSubmission.csv
download data
explore data
data cleaning
visualizing
findings
import pandas as pd
import numpy as np
import matplotlib .pyplot as plt
% matplotlib inline
import seaborn as sns
#Read CSV file
df_features = pd .read_csv ('features.csv' , sep = ',' )
df_stores = pd .read_csv ('stores.csv' , sep = ',' )
df_train = pd .read_csv ('train.csv' , sep = ',' )
df_test = pd .read_csv ('test.csv' , sep = ',' ) df_features .info ()
df_features .head ()<class 'pandas.core.frame.DataFrame'>
RangeIndex: 8190 entries, 0 to 8189
Data columns (total 12 columns):
Store 8190 non-null int64
Date 8190 non-null object
Temperature 8190 non-null float64
Fuel_Price 8190 non-null float64
MarkDown1 4032 non-null float64
MarkDown2 2921 non-null float64
MarkDown3 3613 non-null float64
MarkDown4 3464 non-null float64
MarkDown5 4050 non-null float64
CPI 7605 non-null float64
Unemployment 7605 non-null float64
IsHoliday 8190 non-null bool
dtypes: bool(1), float64(9), int64(1), object(1)
memory usage: 711.9+ KB
Store
Date
Temperature
Fuel_Price
MarkDown1
MarkDown2
MarkDown3
MarkDown4
MarkDown5
CPI
Unemployment
IsHoliday
0
1
2010-02-05
42.31
2.572
NaN
NaN
NaN
NaN
NaN
211.096358
8.106
False
1
1
2010-02-12
38.51
2.548
NaN
NaN
NaN
NaN
NaN
211.242170
8.106
True
2
1
2010-02-19
39.93
2.514
NaN
NaN
NaN
NaN
NaN
211.289143
8.106
False
3
1
2010-02-26
46.63
2.561
NaN
NaN
NaN
NaN
NaN
211.319643
8.106
False
4
1
2010-03-05
46.50
2.625
NaN
NaN
NaN
NaN
NaN
211.350143
8.106
False
df_stores .info ()
df_stores .head ()<class 'pandas.core.frame.DataFrame'>
RangeIndex: 45 entries, 0 to 44
Data columns (total 3 columns):
Store 45 non-null int64
Type 45 non-null object
Size 45 non-null int64
dtypes: int64(2), object(1)
memory usage: 1.1+ KB
Store
Type
Size
0
1
A
151315
1
2
A
202307
2
3
B
37392
3
4
A
205863
4
5
B
34875
df_train .info ()
df_train .head ()<class 'pandas.core.frame.DataFrame'>
RangeIndex: 421570 entries, 0 to 421569
Data columns (total 5 columns):
Store 421570 non-null int64
Dept 421570 non-null int64
Date 421570 non-null object
Weekly_Sales 421570 non-null float64
IsHoliday 421570 non-null bool
dtypes: bool(1), float64(1), int64(2), object(1)
memory usage: 13.3+ MB
Store
Dept
Date
Weekly_Sales
IsHoliday
0
1
1
2010-02-05
24924.50
False
1
1
1
2010-02-12
46039.49
True
2
1
1
2010-02-19
41595.55
False
3
1
1
2010-02-26
19403.54
False
4
1
1
2010-03-05
21827.90
False
df_test .info ()
df_test .head ()<class 'pandas.core.frame.DataFrame'>
RangeIndex: 115064 entries, 0 to 115063
Data columns (total 4 columns):
Store 115064 non-null int64
Dept 115064 non-null int64
Date 115064 non-null object
IsHoliday 115064 non-null bool
dtypes: bool(1), int64(2), object(1)
memory usage: 2.7+ MB
Store
Dept
Date
IsHoliday
0
1
1
2012-11-02
False
1
1
1
2012-11-09
False
2
1
1
2012-11-16
False
3
1
1
2012-11-23
True
4
1
1
2012-11-30
False
# converting date to datetime object
#df_features['Date'] = df_features['Date'].apply(pd.to_datetime)
print (f"Minimum Date: { min (df_features ['Date' ])} )
print (f"\n Maximum Date: { max (df_features ['Date' ])} )Minimum Date: 2010-02-05
Maximum Date: 2013-07-26
#check null values
df_features .isnull ().sum ()Store 0
Date 0
Temperature 0
Fuel_Price 0
MarkDown1 4158
MarkDown2 5269
MarkDown3 4577
MarkDown4 4726
MarkDown5 4140
CPI 585
Unemployment 585
IsHoliday 0
dtype: int64
df_features .fillna (0 ,inplace = True )
df_features .isnull ().sum ()Store 0
Date 0
Temperature 0
Fuel_Price 0
MarkDown1 0
MarkDown2 0
MarkDown3 0
MarkDown4 0
MarkDown5 0
CPI 0
Unemployment 0
IsHoliday 0
dtype: int64
df_features [["Temperature" ]] = df_features [["Temperature" ]].fillna (df_features [["Temperature" ]].mean ())
df_features [["Fuel_Price" ]] = df_features [["Fuel_Price" ]].fillna (df_features [["Fuel_Price" ]].mean ())
df_features [["CPI" ]] = df_features [["CPI" ]].fillna (df_features [["CPI" ]].mean ())df_features .isnull ().sum ()Store 0
Date 0
Temperature 0
Fuel_Price 0
MarkDown1 0
MarkDown2 0
MarkDown3 0
MarkDown4 0
MarkDown5 0
CPI 0
Unemployment 0
IsHoliday 0
dtype: int64
print (f"Minimum Date: { min (df_train ['Date' ])} )
print (f"\n Maximum Date: { max (df_train ['Date' ])} )Minimum Date: 2010-02-05
Maximum Date: 2012-10-26
Store           0
Dept            0
Date            0
Weekly_Sales    0
IsHoliday       0
dtype: int64
labels = 'type A' ,'type B' ,'type C'
sizes = [(df_stores .Type .value_counts ()['A' ]/ (45 ))* 100 ,(df_stores .Type .value_counts ()['B' ]/ (45 ))* 100 ,(df_stores .Type .value_counts ()['C' ]/ (45 ))* 100 ]
colors = ['green' , 'yellow' , 'blue' ]
explode = (0.1 , 0 , 0 )
plt .pie (sizes , explode = explode , labels = labels , colors = colors ,
autopct = '%.1f%%' , shadow = False , startangle = 90 )
plt .legend (labels , loc = "best" )
plt .axis ('equal' )
plt .show ()
df_stores .Type .value_counts ()A 22
B 17
C 6
Name: Type, dtype: int64
df_features_stores = df_features .merge (df_stores , how = 'inner' , on = 'Store' )
df = df_train .merge (df_features_stores , how = 'inner' , on = ['Store' ,'Date' ,'IsHoliday' ])
df ['Date' ] = pd .to_datetime (df ['Date' ])
df .info ()<class 'pandas.core.frame.DataFrame'>
Int64Index: 421570 entries, 0 to 421569
Data columns (total 16 columns):
Store 421570 non-null int64
Dept 421570 non-null int64
Date 421570 non-null datetime64[ns]
Weekly_Sales 421570 non-null float64
IsHoliday 421570 non-null bool
Temperature 421570 non-null float64
Fuel_Price 421570 non-null float64
MarkDown1 421570 non-null float64
MarkDown2 421570 non-null float64
MarkDown3 421570 non-null float64
MarkDown4 421570 non-null float64
MarkDown5 421570 non-null float64
CPI 421570 non-null float64
Unemployment 421570 non-null float64
Type 421570 non-null object
Size 421570 non-null int64
dtypes: bool(1), datetime64[ns](1), float64(10), int64(3), object(1)
memory usage: 51.9+ MB
df ["year" ] = df ["Date" ].dt .year
df ["month" ] = df ["Date" ].dt .month
df ["week" ] = df ["Date" ].dt .month sales_date = df ['Weekly_Sales' ].groupby (df ['Date' ]).mean ()
plt .figure (figsize = (16 ,5 ))
sns .lineplot (weekly_sales_mean .index , weekly_sales_mean .values )
plt .grid ()
plt .title ('sales over time ' , fontsize = 18 )
plt .ylabel ('Sales' , fontsize = 16 )
plt .xlabel ('Date' , fontsize = 16 )
plt .show ()
sales_store = df ['Weekly_Sales' ].groupby (df ['Store' ]).mean ()
plt .figure (figsize = (16 ,5 ))
sns .barplot (sales_store .index , sales_store .values )
plt .grid ()
plt .title ('sales per store ' , fontsize = 18 )
plt .ylabel ('Sales' , fontsize = 16 )
plt .xlabel ('Store' , fontsize = 16 )
plt .show ()
sales_store .max () - sales_store .min ()df .groupby ("Type" )["Weekly_Sales" ].mean ()Type
A 20099.568043
B 12237.075977
C 9519.532538
Name: Weekly_Sales, dtype: float64
# # Figure Size
# fig = plt.figure(figsize =(10, 7))
# # Horizontal Bar Plot
# plt.bar(df.Store, df.Weekly_Sales)
# # Show Plot
# plt.show()
hol = df ['Weekly_Sales' ].groupby (df ['Size' ]).mean ()
plt .figure (figsize = (16 ,5 ))
sns .lineplot (hol .index , hol .values )
plt .grid ()
plt .title ('sales - size ' , fontsize = 18 )
plt .ylabel ('Sales' , fontsize = 16 )
plt .xlabel ('size' , fontsize = 16 )
plt .show ()
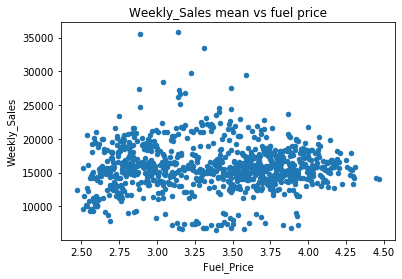
hol = df .groupby ("Fuel_Price" )["Weekly_Sales" ].mean ().reset_index ()
print (hol ["Fuel_Price" ].corr (hol ["Weekly_Sales" ]))
hol .plot .scatter ("Fuel_Price" , "Weekly_Sales" , title = "Weekly_Sales mean vs fuel price" )0.015810449498679695
<matplotlib.axes._subplots.AxesSubplot at 0x1ea083c1da0>
data = pd .concat ([df ['Store' ], df ['Weekly_Sales' ], df ['IsHoliday' ]], axis = 1 )
f , ax = plt .subplots (figsize = (23 , 8 ))
fig = sns .boxplot (x = 'Store' , y = 'Weekly_Sales' , data = data , showfliers = False , hue = "IsHoliday" )
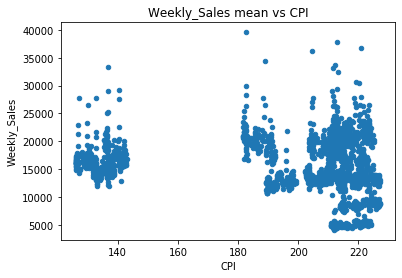
CPI_corr = df .groupby ("CPI" )["Weekly_Sales" ].mean ().reset_index ()
print (CPI_corr ["CPI" ].corr (hol ["Weekly_Sales" ]))
CPI_corr .plot .scatter ("CPI" , "Weekly_Sales" , title = "Weekly_Sales mean vs CPI" )-0.018861475583658933
<matplotlib.axes._subplots.AxesSubplot at 0x1ea1563b400>
holidays = df [['Weekly_Sales' ,'Date' ,'week' ,'year' ,'IsHoliday' ]]
holidays = holidays .loc [holidays ['IsHoliday' ]== True ].drop_duplicates ()
holidays .head ()
Weekly_Sales
Date
week
year
IsHoliday
73
46039.49
2010-02-12
2
2010
True
74
44682.74
2010-02-12
2
2010
True
75
10887.84
2010-02-12
2
2010
True
76
35351.21
2010-02-12
2
2010
True
77
29620.81
2010-02-12
2
2010
True


