Our Client, Louise, wants to know how different Play campaigns fared in relation to their launch dates and funding goals.
Analysing how each of these two parameters, campaign launch dates and their funding goals, can effect the play campaigns outcomes using data provided with the Kickstarter file.
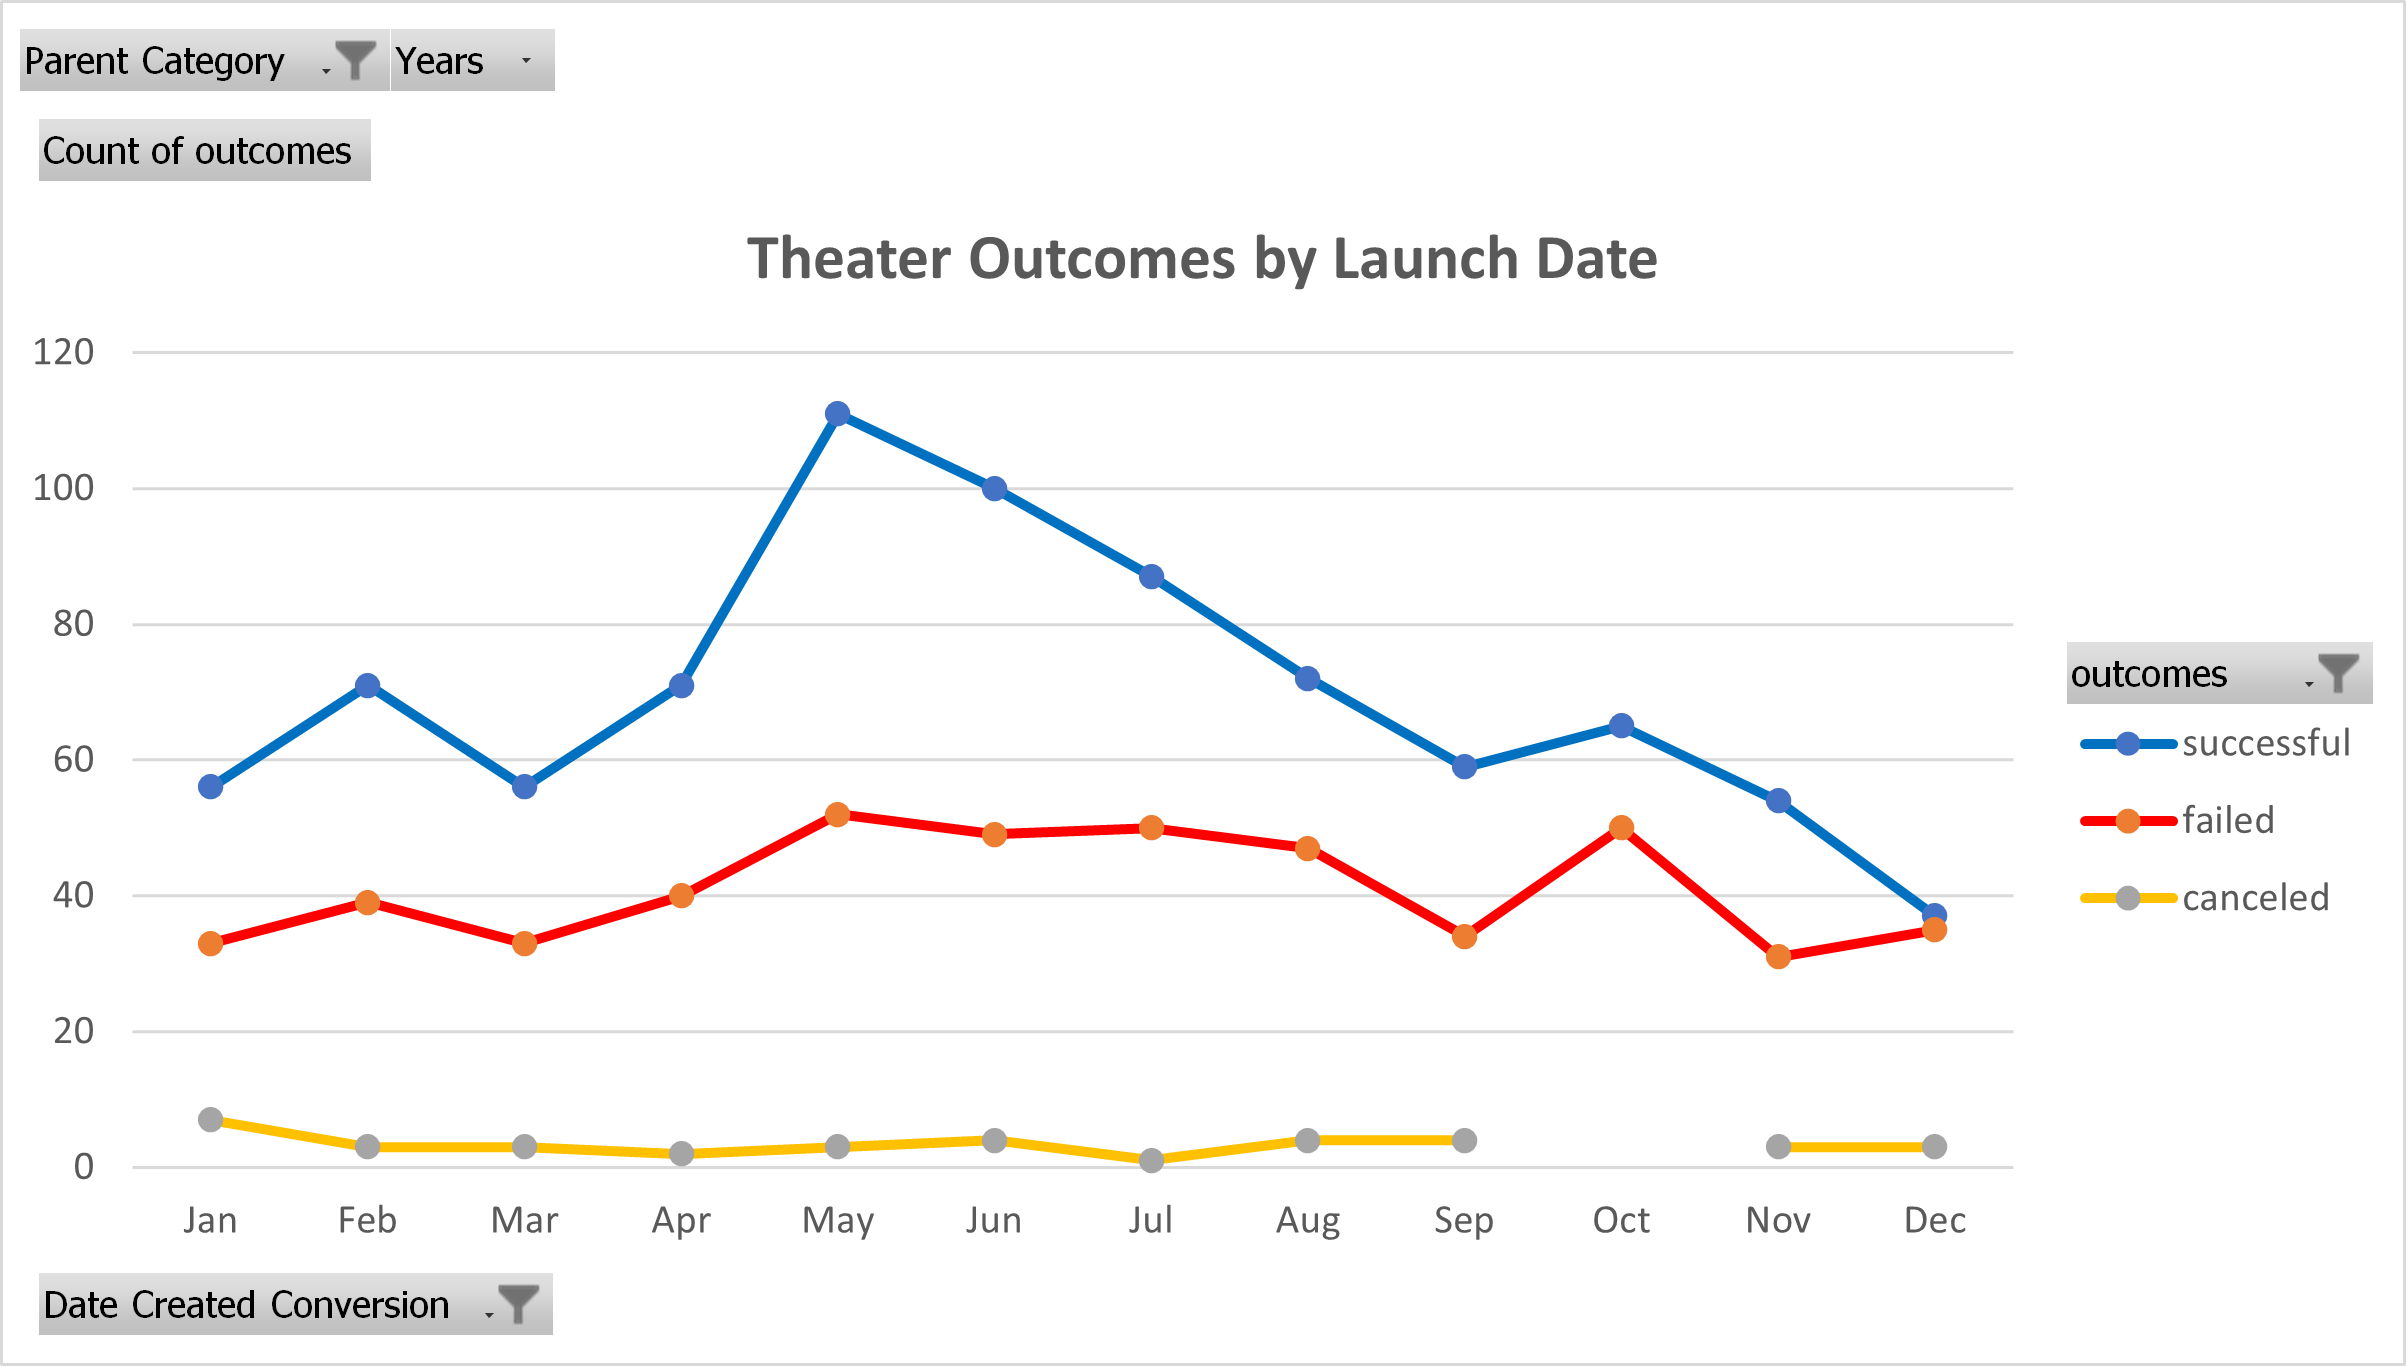
For this section, at first, I extracted the Launch Year out of our Launch date column with the =year() formula. Then, I created a PivotTable with Parent Category and Years as its filters, Outcome as its columns and Date Conversion as its rows. Secondly, I set the filter of Parent Category to Theater. The result table shows us the number of Successful, Failed and Canceled Theater Campagins for each month of year.
Our data shows that theater play fund raising campaigns can be more successful mid-year, late spring / early summer. The highest number of successful campaigns belong to month of May while the least successful campaigns were launched in December. The analysis also shows that beginning months of the year as well as end of the year, cannot be a good launch date for the theater play campaigns Launch date.
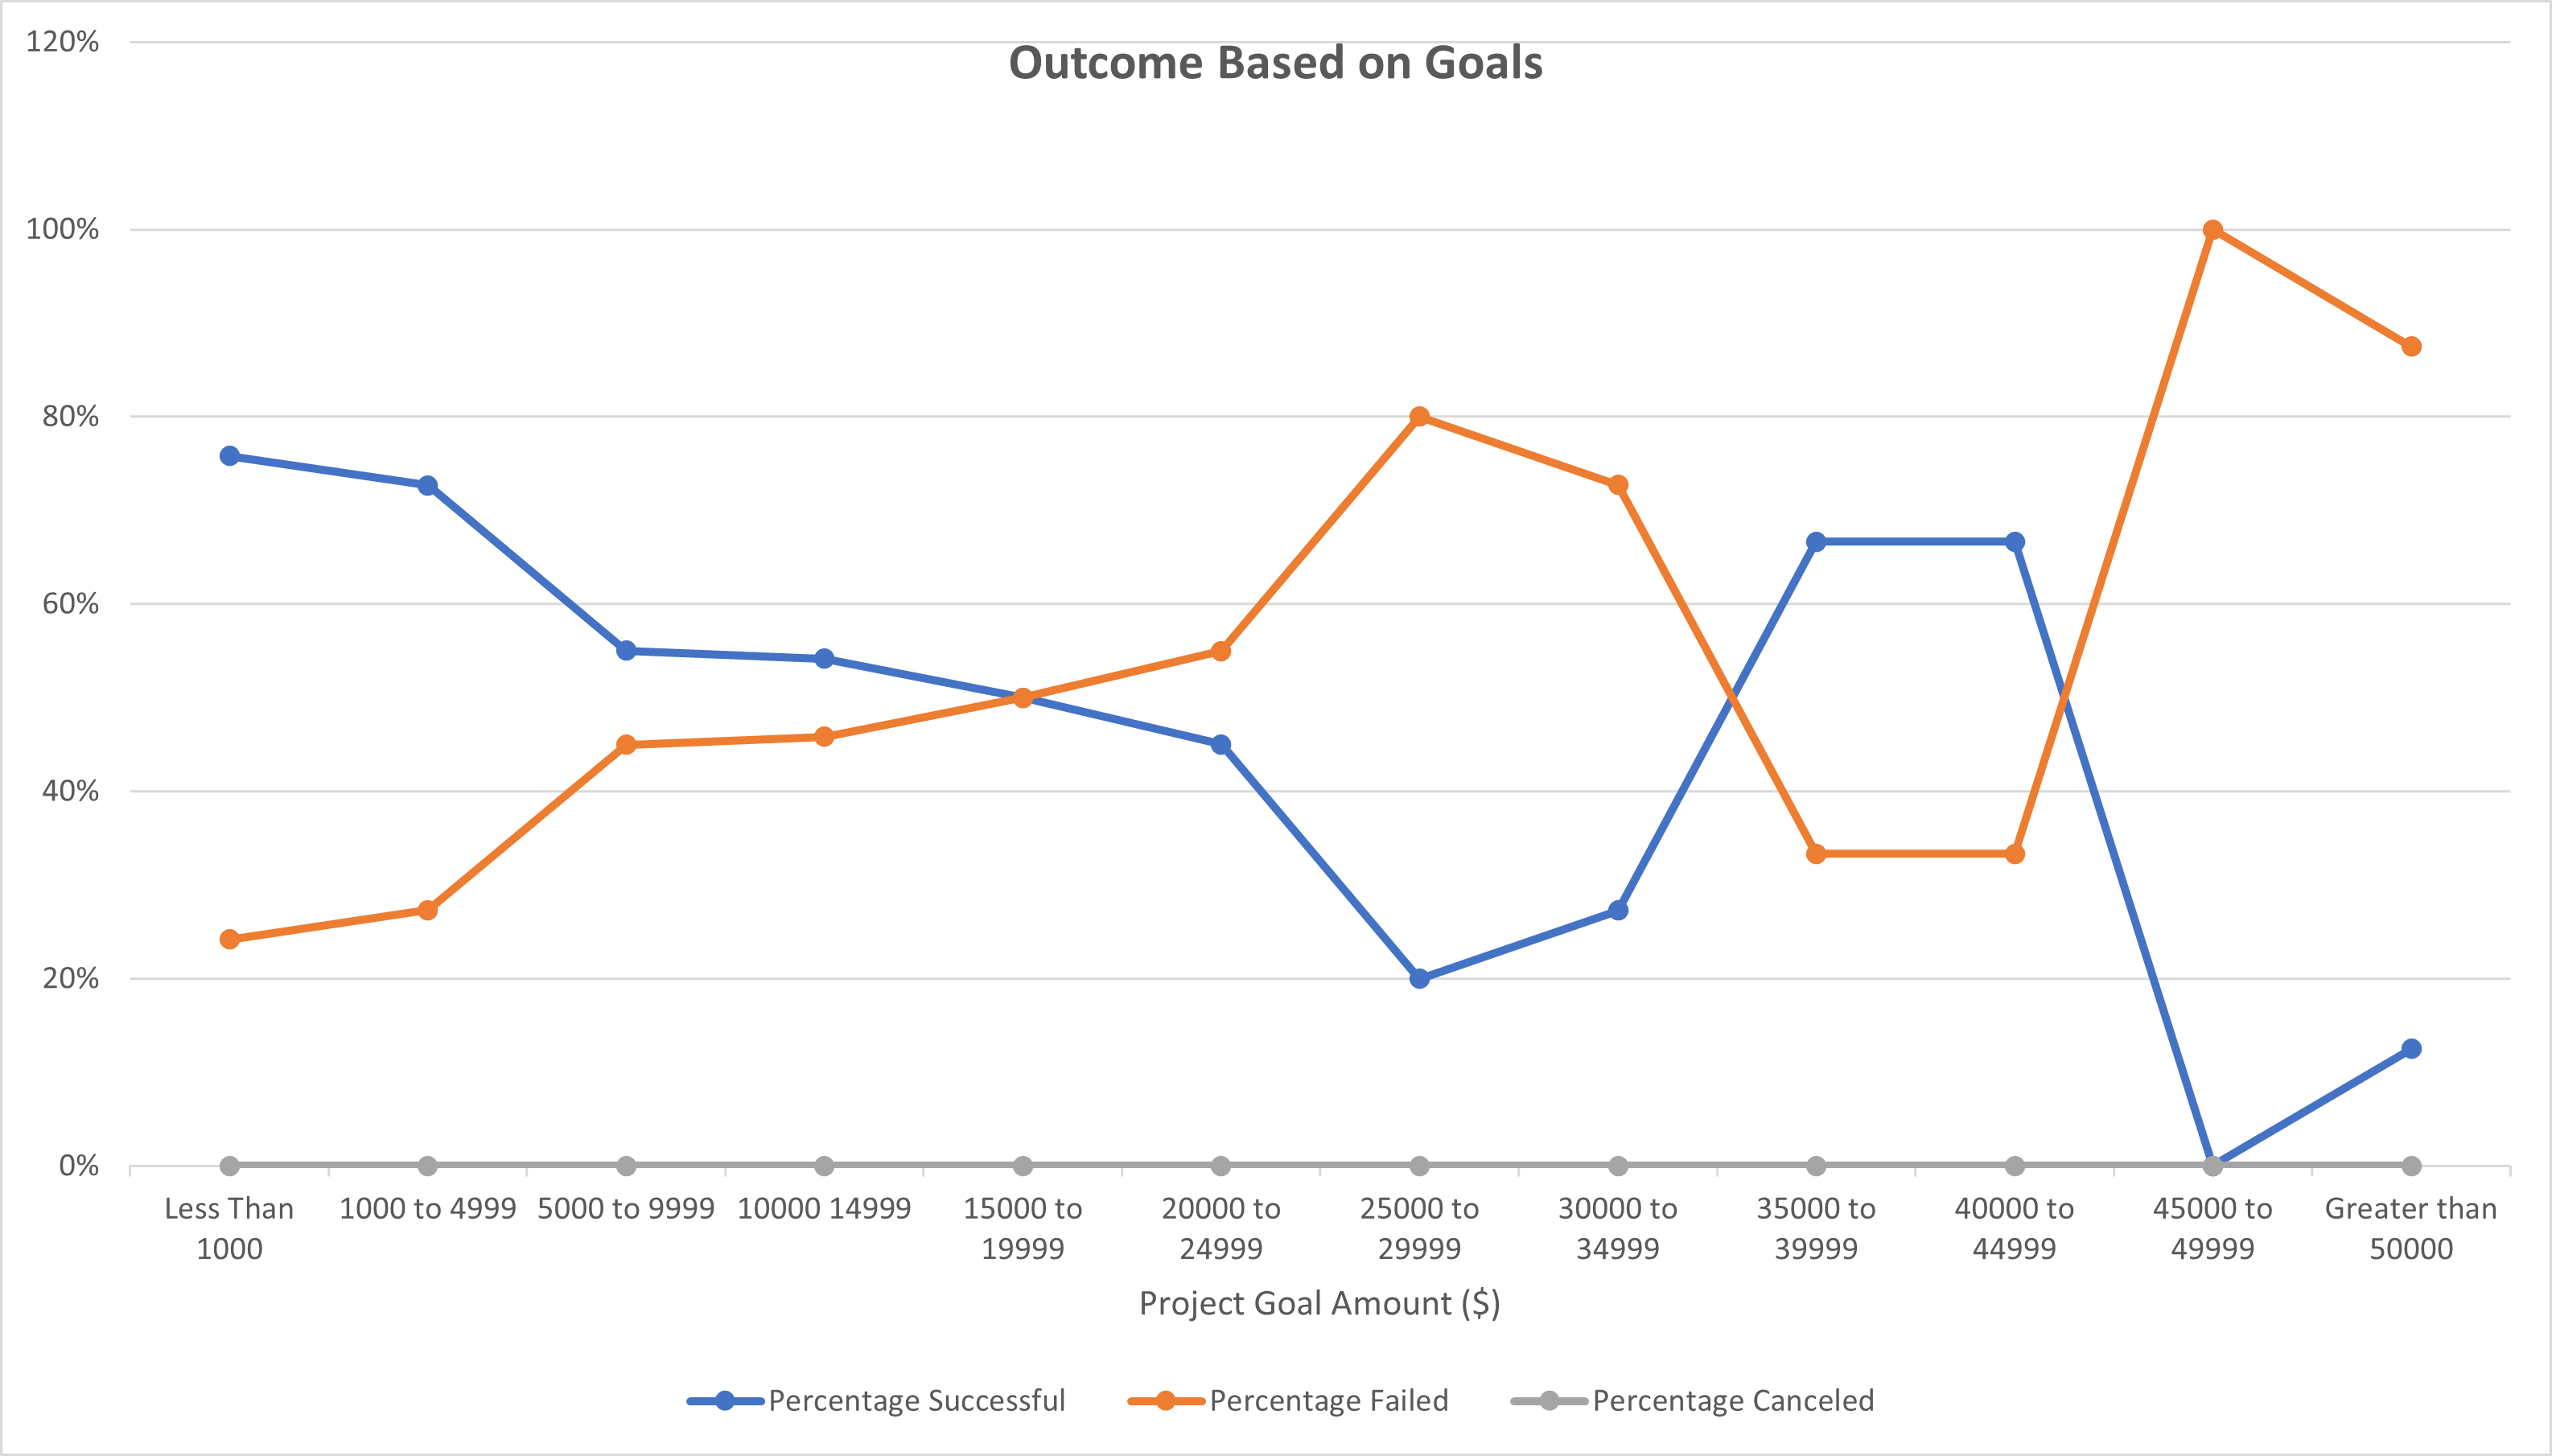
The data shows that play fund raising campaigns within following goal amount are tend to be more successful:
- $4,999 or less
- Between $35,000 to $40,000
At the beginning with the Outcome based on Goals section of challenge, the numbers I received with my COUNTIF formulas were not the same as final results mentioned on challenge guideline. At first, I could not figure out what the problem is. However, once I started checking the challenge guidelines, I noticed that the results should have only included the Theater Play campaigns, not all campaigns. That is when I realised that in my COUNTIF formula, I need to add a condition to limit the results to only play campaigns.
-
What are two conclusions you can draw about the Outcomes based on Launch Date? Month of May has the highest number of successful fund raising campaigns whereas, December has the lowest number of succesful campaigns.
-
What can you conclude about the Outcomes based on Goals? Based on our data, the higher funding goal of a campaign is, there will be a higher risk of failing for it. Also, we can see that the success rate declines as the goal amount increase. To conclude, Campaigns which have Funding goal of $4,999 and less have the highest success range.
-
What are some limitations of this dataset? There are other elements which can effect the success of a Theater Play like their genre. We also have some outliners which can cause ditruption to our analysis.
-
What are some other possible tables and/or graphs that we could create?
- Outcome based on Deadline or Duration of the Campaign
- A box-whisker plot to have the outliners identified for each campaign parent category
- Email : neda.ahmadi.jesh@gmail.com
- Linkedin: www.linkedin.com/in/neda-ahmadi-j

