In this tutorial, you'll familiarize yourself with Node-RED, its nodes, and its flow-based programming model. You'll learn how to extend Node-RED by installing additional nodes, working with an external library, and creating dashboards. With this tutorial, you build an application that analyzes earthquake-related data along with weather data to understand when and where earthquakes are happening around the world.
Node-RED is an open-source visual flow-based programming tool used for wiring not only Internet of Things (IoT) components, but also integrating an ensemble of service APIs, including ones provided by IBM Cloud. A node in Node-RED performs a particular functionality, which typically minimizes the amount of coding that is required to build a given application. If you've never used Node-RED before, you might want to start by reviewing this brief video tutorial, "Creating your first Node-RED flow."
Because this tutorial explores the nodes and features of Node-RED, it might not present the optimal way of developing this application. It is also worth mentioning that the application presented here was developed in a country or region where the purchase or usage of the Weather Company Data for IBM Cloud service is not allowed. I encourage exploring the Weather Company Data service in case its utilization is permitted in your region.
In this tutorial, you will create a simplified Earthquake Monitoring System. The application has two main components:
-
A web service that uses real-time GeoJSON feeds from the USGS Earthquake Hazard Program for displaying earthquake information every hour. Based on the location coordinates (longitude & latitude) of a given earthquake point, the current weather conditions are retrieved using an OpenWeatherMap.
-
A dashboard that displays the earthquake points retrieved from the web service component, whose details are also saved in a Cloudant database, onto a world map. Additionally, the latest earthquake-related tweets, as well as the frequency of the earthquakes happening in each region, are presented.
So let's get started!
After you complete this tutorial, you will know how to:
- Create a Node-RED Starter application running on IBM Cloud.
- Install and work with nodes available in the Node-RED Library.
- Make external packages or modules available to a function node.
- Work with Dashboard nodes.
- Secure a Web API that was created in a Node-RED Starter application.
- Create an IBM Cloud lite account, if you don't already have one.
- Create an account on OpenWeatherMap to retrieve an API key
- Create an account on Twitter and create a Twitter application
It will take about 1 hour to complete this tutorial, including the prerequisites.
-
Log in to your IBM Cloud account.
-
Open the IBM Cloud Catalog.
-
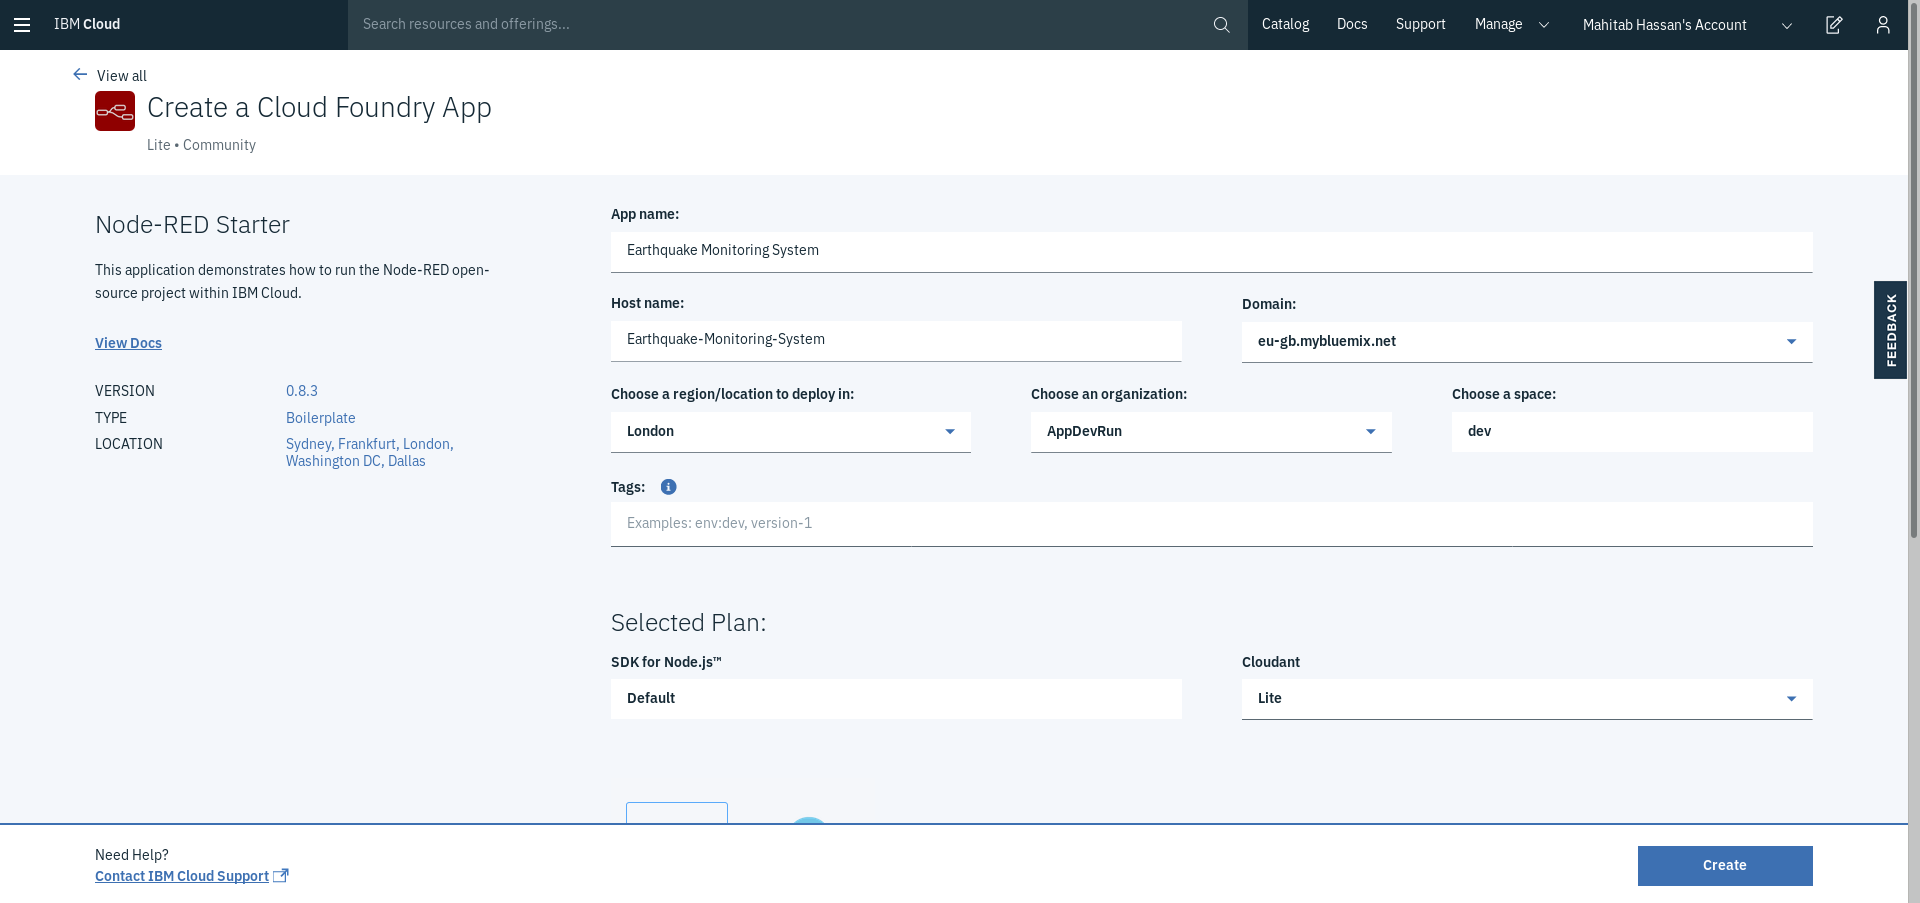
Select the Starter Kits category, then click Node-RED Starter.
-
Enter a unique name for the app. This name is also used as the hostname. If you are using a lite account, the Region, Organization, and Space fields are pre-populated with the appropriate values.
-
In the Selected Plan section, for the Cloudant database, choose the Lite option.
-
Click the Create button.
-
After the status of your application changes to
Running, click Visit App URL. -
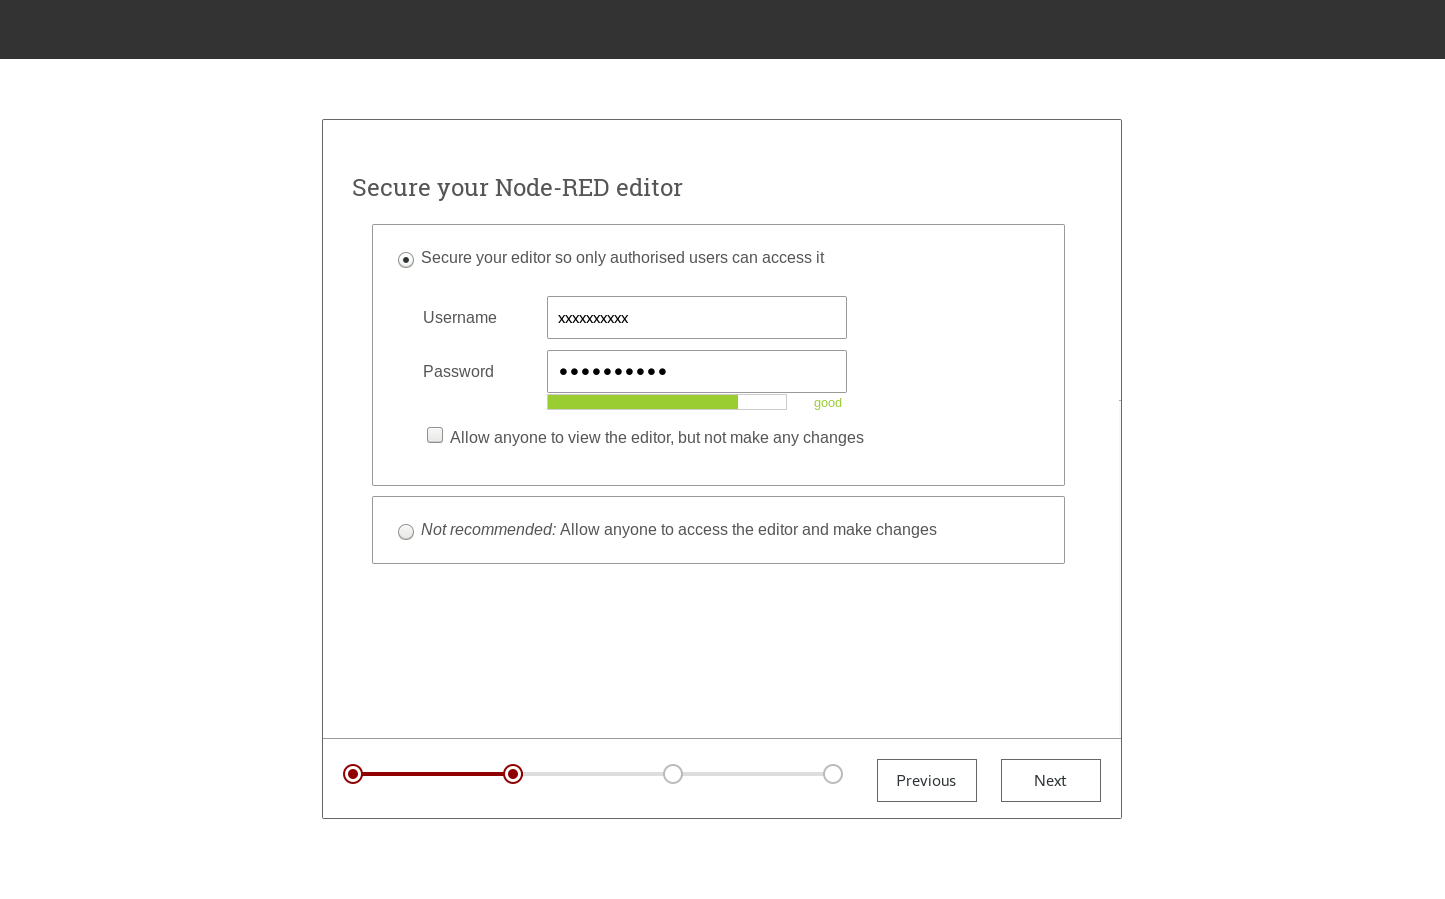
Follow the directions to access the Node-RED flow editor. You are encouraged to secure your Node-RED flow editor to ensure that only authorized users can access it.
-
Click on Go to your Node-RED flow editor. A new flow called
Flow 1is opened in the Node-RED flow editor. If you secured your Node-RED flow editor, you will first be asked to enter the username and password that you just set up.


Our Earthquake Monitoring System application has two main components:
- The web service component
- The dashboard component
The steps to create these two components in our Node-RED app follow. I encourage you to follow the steps to learn just how easy it is to create apps using Node-RED.
You can also import both of the flows explained in this tutorial. First, download or copy the contents of the flows.json file to the clipboard. Then, go to the hamburger menu in your Node-RED editor, and select Import > Clipboard. Then, paste the contents into the dialog, and click Import. In case you selected to download the file, make sure to select select a file to import, then click Import. You'll still need to follow the steps in this tutorial to configure all the nodes and to make a package available to a function node.
-
Double-click the tab with the flow name, and call it
Earthquake Details. -
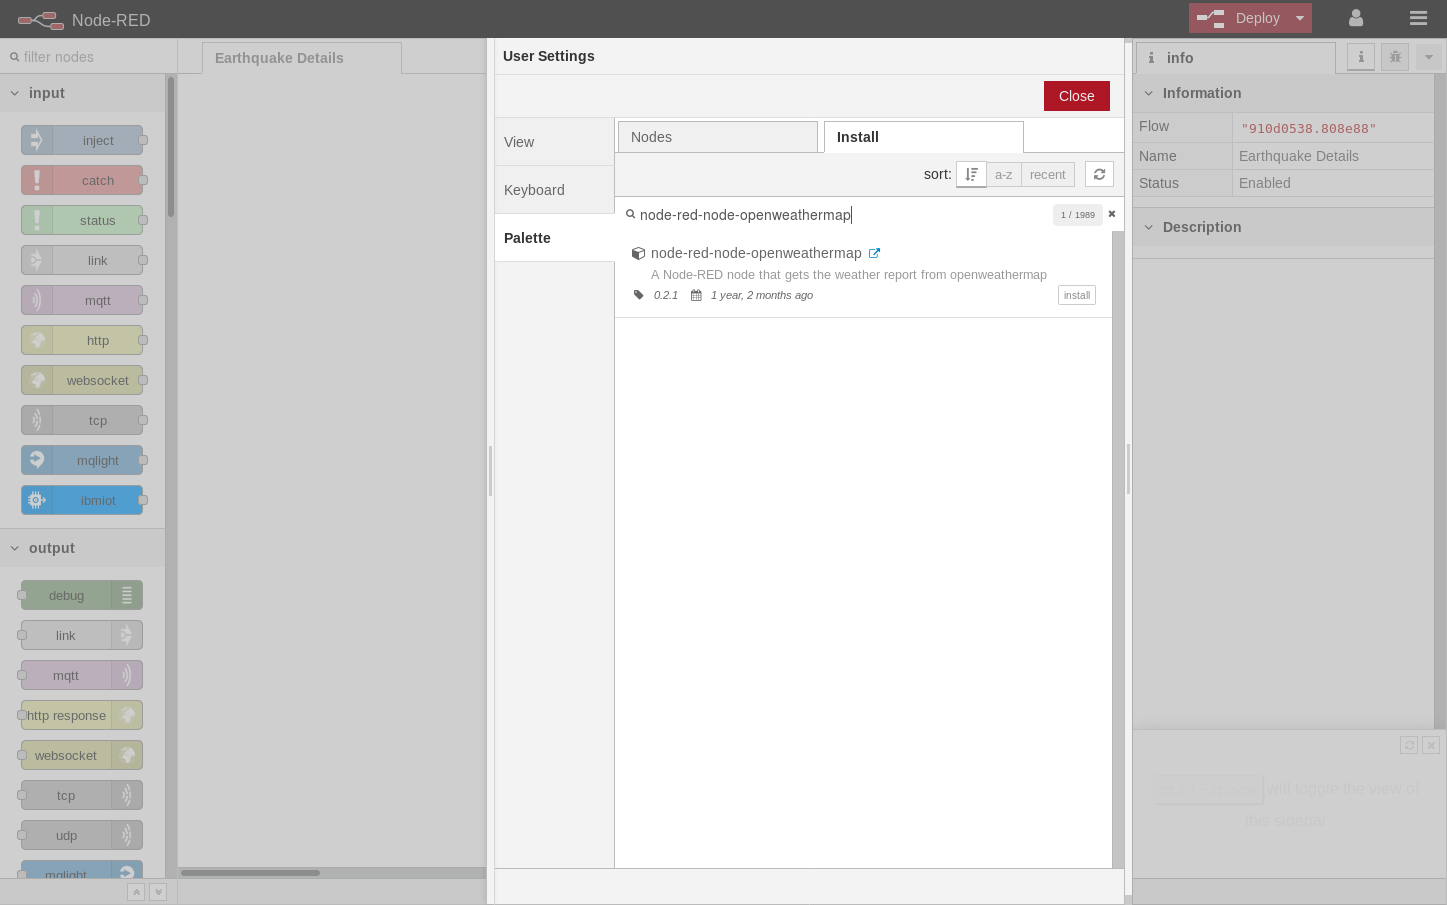
Click the hamburger menu, and then click Manage palette. Look for node-red-node-openweathermap to install these additional nodes in your palette.
-
Add an HTTP input node to your flow.
-
Double-click the node to edit it. Set the method to
GETand set the URL to/earthquakeinfo-hr. -
Add an HTTP response node, and connect it to the previously added HTTP input node. All other nodes introduced in this sub-section is to be added between the HTTP input node and the HTTP response node.
-
Add an HTTP request node and set the URL to
https://earthquake.usgs.gov/earthquakes/feed/v1.0/summary/all_hour.geojson, the Method to GET and the Return to a parsed JSON object. This will allow extracting all earthquakes that occurred within the last hour. Name this nodeGet Earthquake Info from USGS.
-
Add a change node. Double-click the node to modify it. Name this node
Set Earthquake Info. In the Rules section, add rules to Deletemsg.topic,msg.headers,msg.statusCode,msg.responseUrlandmsg.redirectListand Setmsg.payloadto the following JSONata expression.payload.features.{ "type":properties.type, "magnitude": properties.mag, "location": properties.place, "longitude":geometry.coordinates[0], "latitude":geometry.coordinates[1], "depth":geometry.coordinates[2], "timestamp": $fromMillis( properties.time, '[H01]:[m01]:[s01] [z]', '+0400' ), "source": properties.net } -
Add a split node, which will split the earthquake information points into different messages based on the location.
-
Add a change node to set the longitude and latitude to the right properties, which will get fed into the openweathermap node. In the Rules section, you will Set
msg.detailstomsg.payload,msg.location.lontomsg.payload.longitude, andmsg.location.lattomsg.payload.latitude.Name this nodeSet Lon & Lat.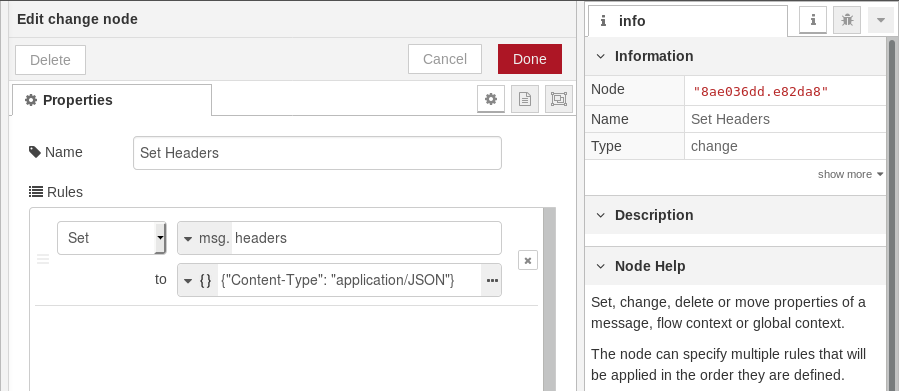
-
Add an openwethermap node to which you will be adding the API key from the OpenWeatherMap site. (Log in to the site with the account you created.)
-
Add another change node that will Set the
msg.payloadto the output of a JSONata expression that will format the messages correctly. Name the nodeAdd Weather Data. The JSONata expression is as follows.msg.{ "name": parts.index, "Place": details.place, "Location":details.location, "Country":location.country, "mag":details.magnitude, "Source":details.source, "Timestamp":details.timestamp, "lon": location.lon, "lat":location.lat, "Type":details.type, "Temperature":data.main.temp & ' Kelvin', "Pressure":data.main.pressure & ' hPa', "Humidity":data.main.humidity & ' %', "Wind Speed":data.wind.speed & ' meter(s)/sec', "Wind Direction":data.wind.deg & ' degree(s)', "Cloud Coverage":data.clouds.all & ' %', "icon":'earthquake', "intensity":details.magnitude / 10 } -
Click Deploy for all changes to take effect.


Before being able to finish the web service component, you need to make the countryjs package available to the function node, which will allow us to set the region and country per earthquake point.
-
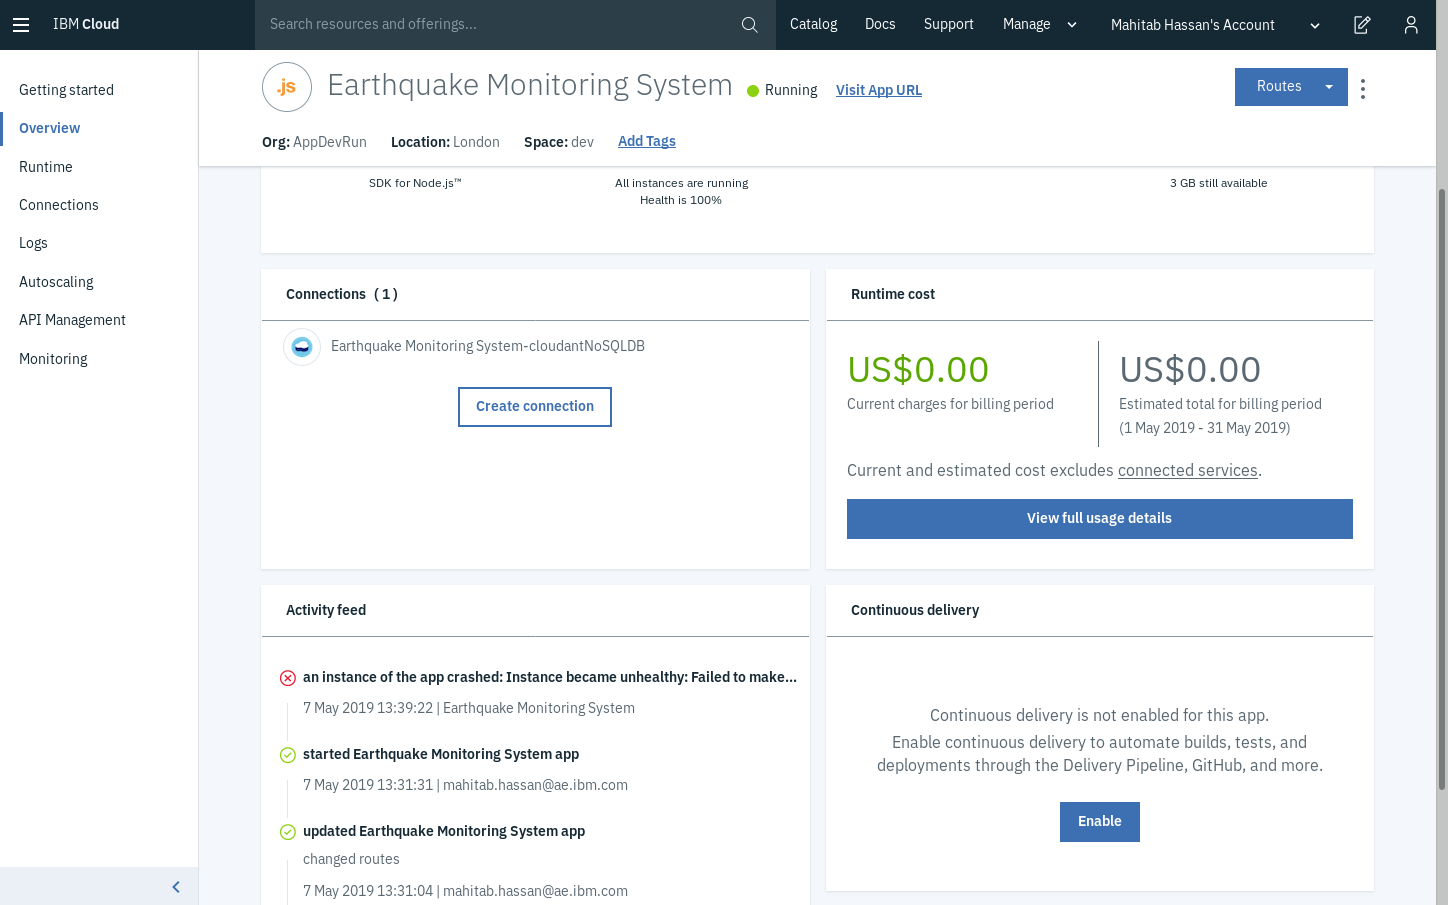
Go back to the IBM Cloud application that you created.
-
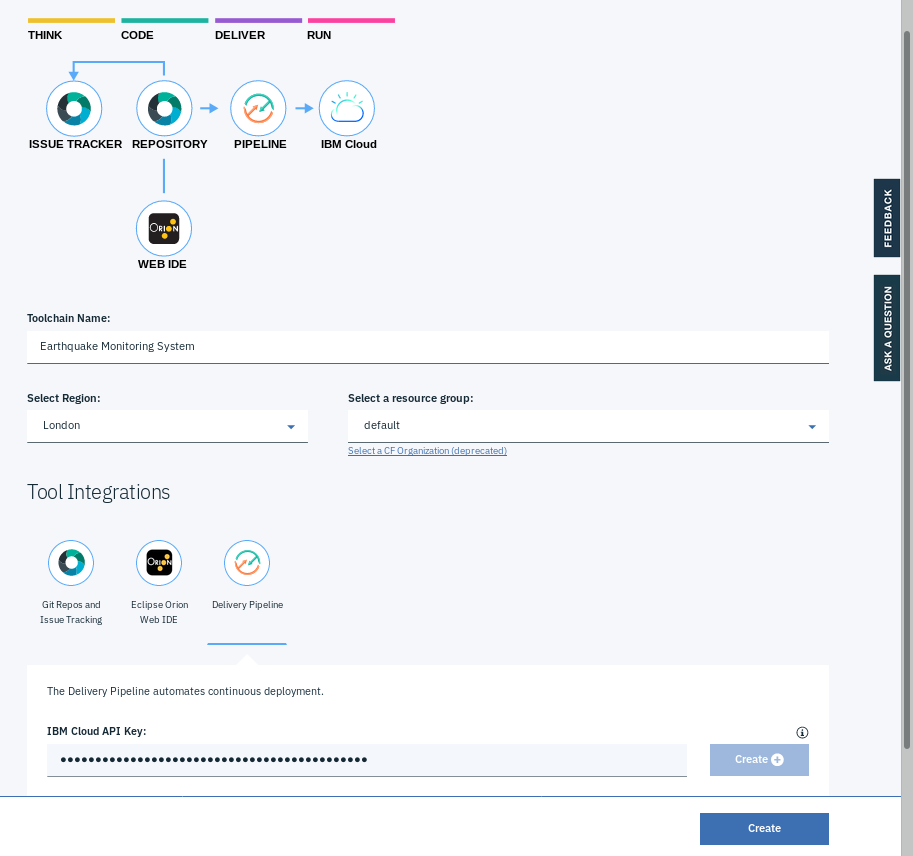
Click Overview. In the Continuous delivery section, click Enable.
-
Confirm all the pre-populated details. Then, under Tool Integrations, select Delivery Pipeline, and then click Create+ to generate an IBM Cloud API Key.
-
At the bottom of the page, click the Create button.
-
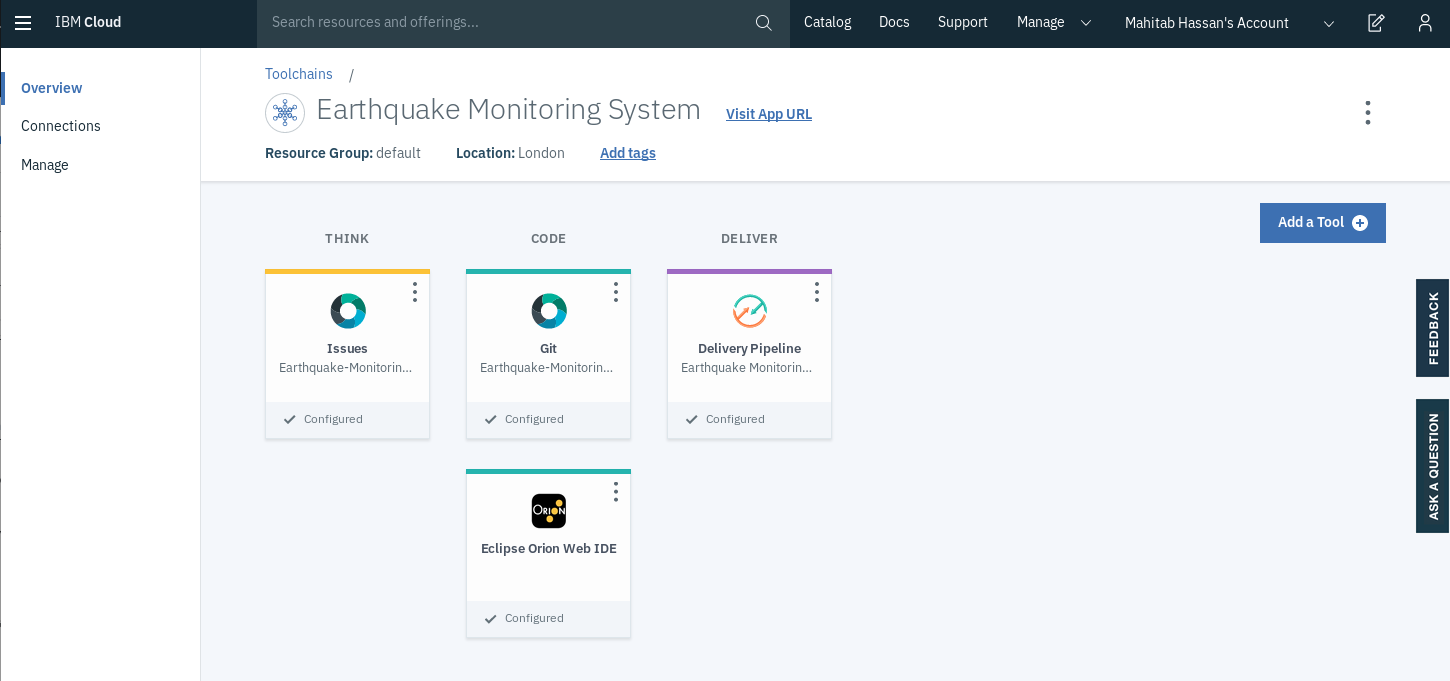
Now, you need to configure the files to make the countryjs package available to the function node. In the Toolchains window, do one of the following steps:
- Clone the repository from the Git action, and make the edits to the files locally.
- Open the Eclipse Orion Web IDE to edit the files in the IBM Cloud.
-
Edit the
bluemix-settings.jsfile.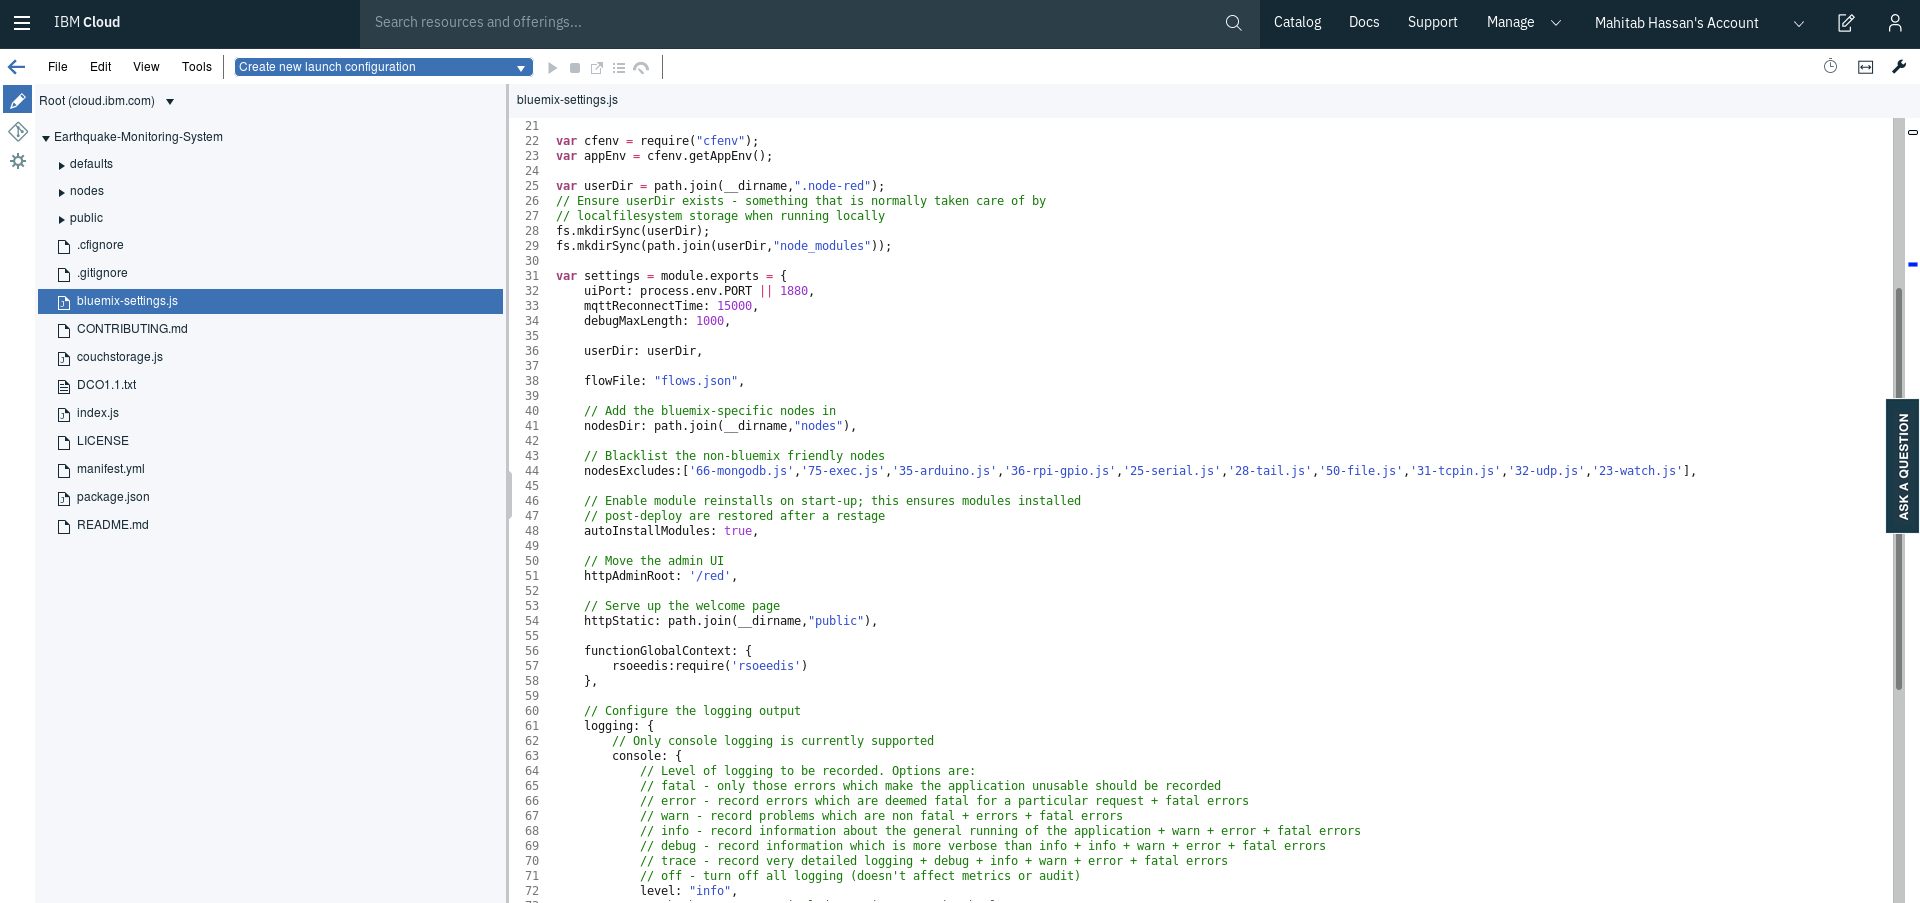
-
Find the definition of the
functionGlobalContextobject, and addcountryjs.functionGlobalContext: { countryjs:require('countryjs') }, -
Edit the
package.jsonfile, and definecountryjsas a dependency."dependencies": { ..., "countryjs":"1.8.0" },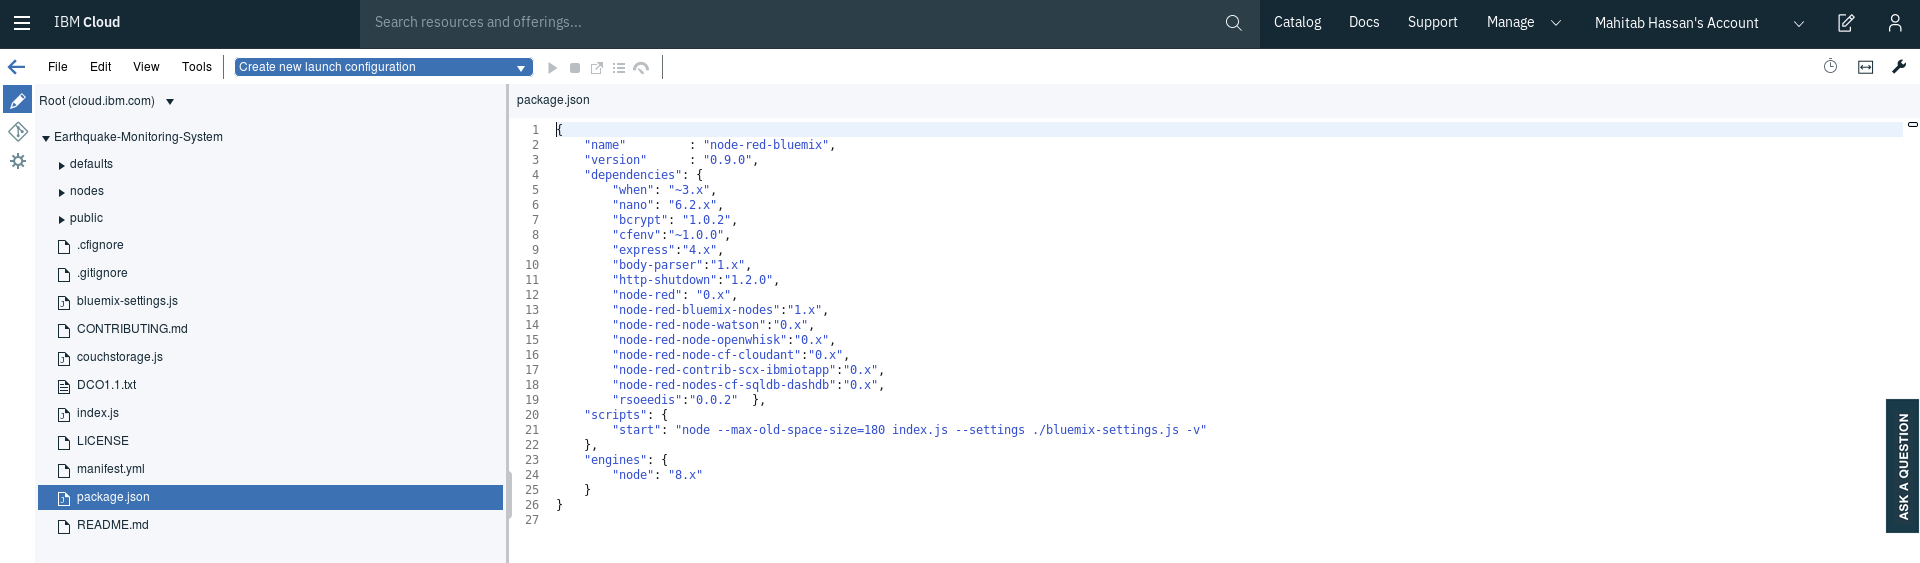
-
Use Git to commit and push all changes.
-
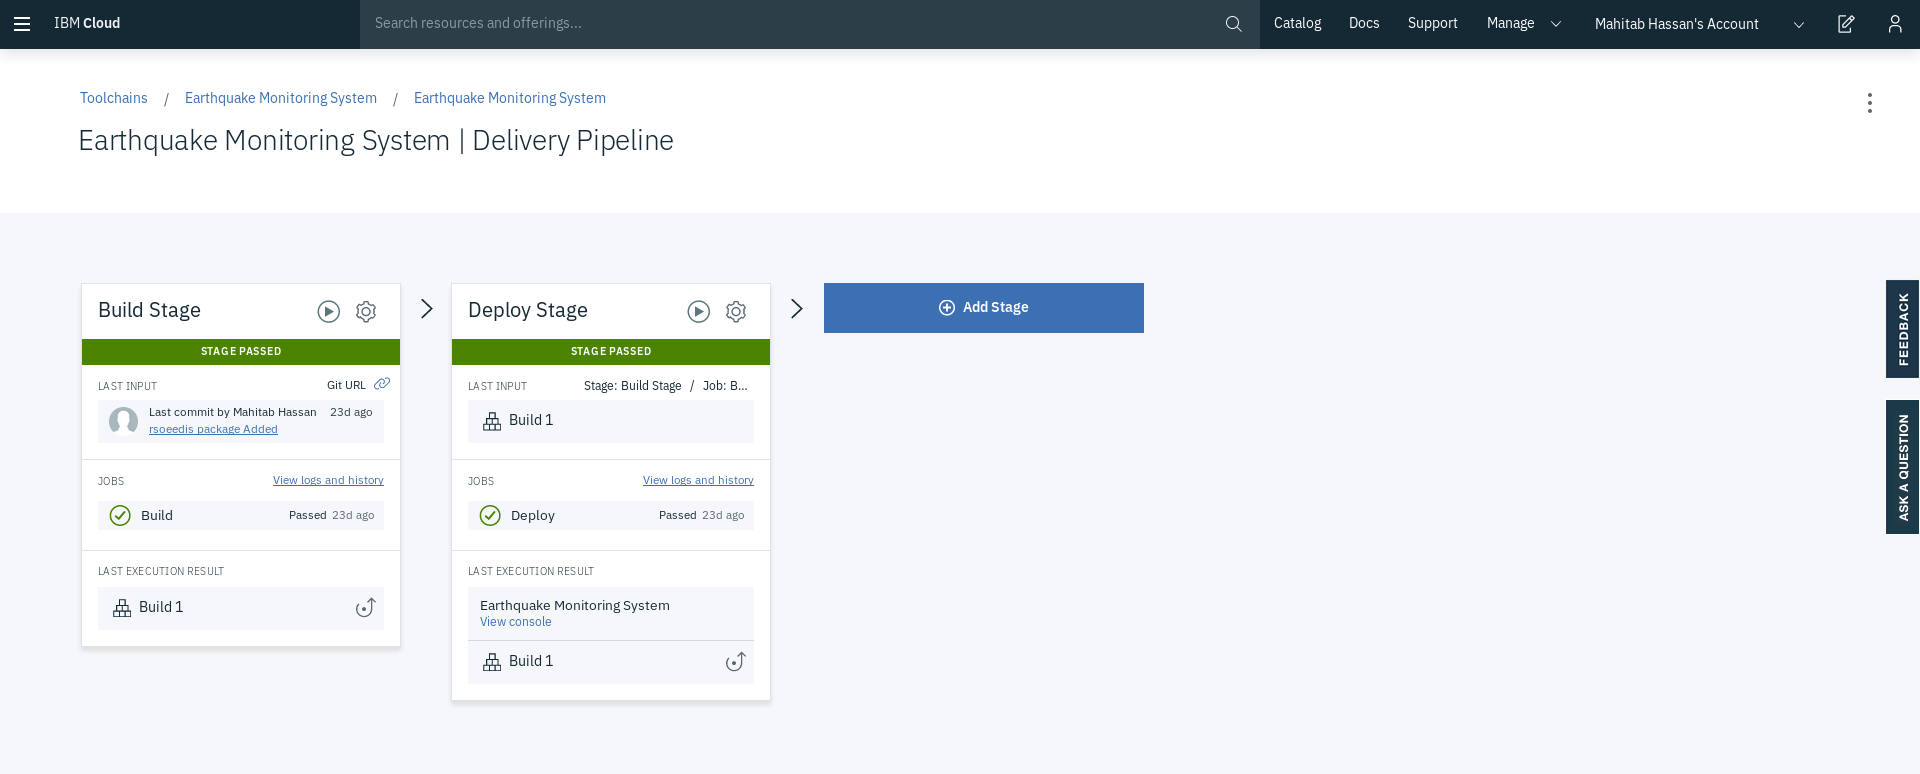
Go back to your application, and wait for your application to finish deploying. You can check that by looking at the Delivery Pipeline card.


-
Add a function node after the change node that you previously added. Name the function node
Set Region & Country using countryjs. Add the following javascript code to the node.var countryjs = global.get('countryjs'); msg.payload.Country = countryjs.name(msg.location.country) msg.payload.Region = countryjs.region(msg.location.country) return msg; -
Add a change node to remove any redundant properties. In the Rules section, add rules to Delete
msg.details,msg.location,msg.data,msg.titleandmsg.description. Name this nodeRemove Unnecessary Properties.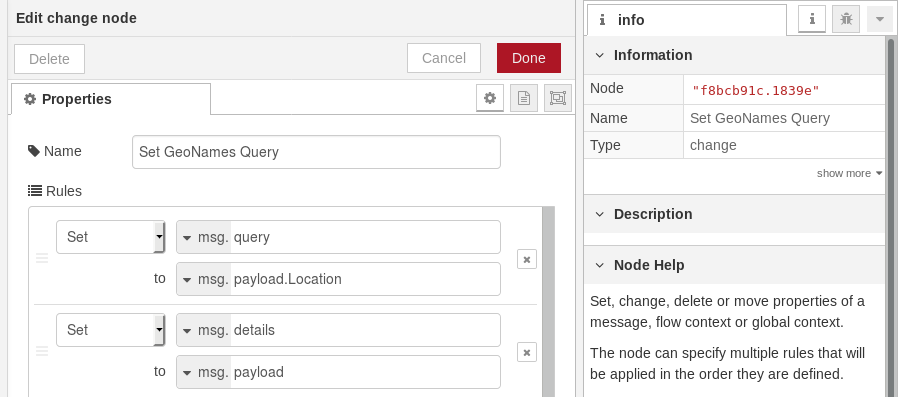
-
Add a join node to join the previous split message into a single one again, which will be returned when an HTTP request is submitted.
-
Add a change node and name it
Set Headers. In the Rules section, add a rule to Setmsg.headersto{ "Content-Type": "application/JSON" }to define that HTTP request to the web service will be returned in a JSON format. -
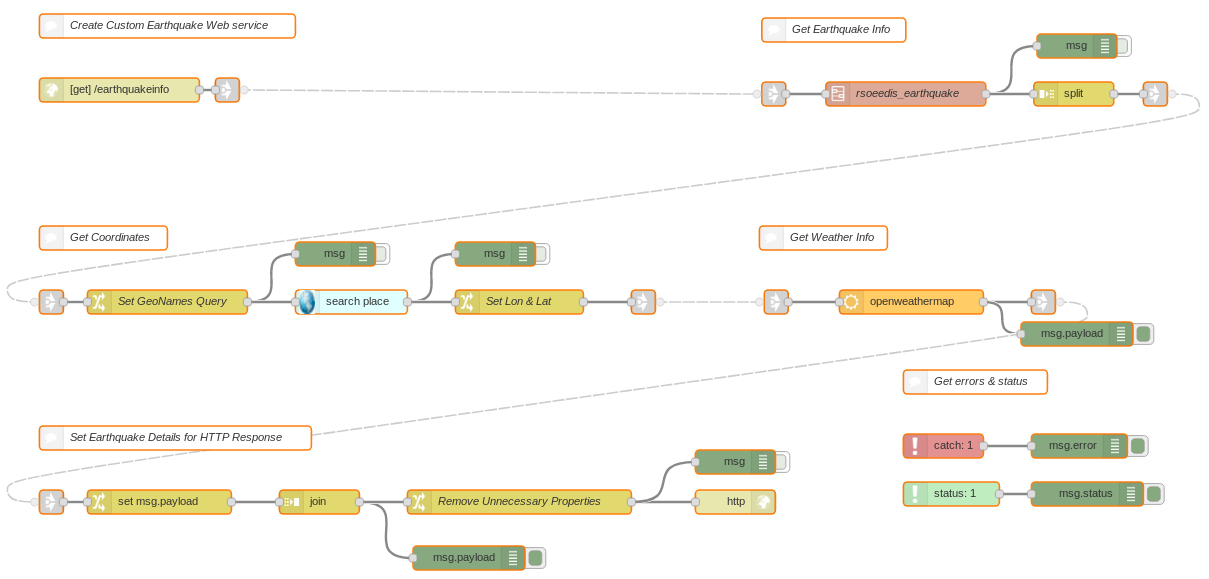
After cleaning up the flow, your flow should look similar to the following.
-
Click Deploy for all changes to take effect.


Now that you've created the web service component, you can create the Dashboard component.
-
Add a new flow, and name it
Dashboard. -
Go to Manage palette, and install the node-red-contrib-web-worldmap and node-red-dashboard packages. node-red-contrib-web-worldmap is used to create a map on which points corresponding to locations where earthquakes are taking place in the last 1 hour are plotted. node-red-dashboard is used to display the latest earthquake-related tweets and the frequency of earthquakes per region.
-
Go to the Dashboard tab that was added next to the Node information and Debug messages tabs. There are three sub-tabs: Layout, Site and Theme. Each of these sub-tabs is used to change the look and feel of the UI.
-
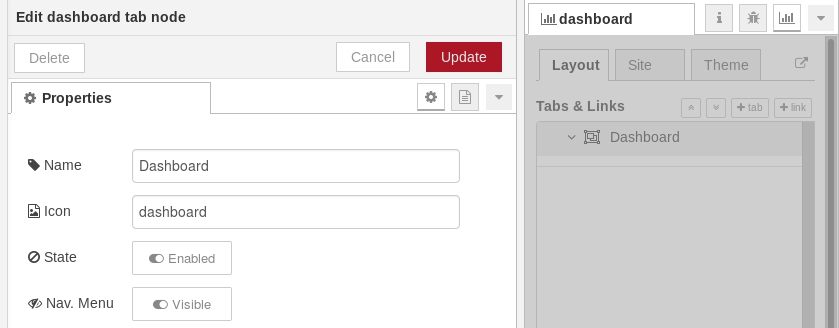
Under Layout, create a tab by clicking on +tab, which can resemble a page in the UI. Edit it as shown in the following image, and click Update.
-
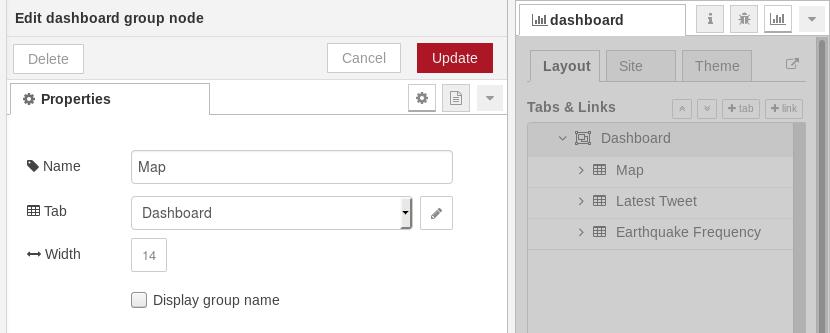
Add a group, which is used to collate similar widgets together, to the tab by clicking on +group. You need to add a total of three groups: one for the Map, one for Latest tweet, and one for Earthquake Frequency. When dashboard nodes are added, they will be added to one of these groups.


-
In the Dashboard flow editing space, add an inject node that will inject a payload with an empty JSON object (
{}) once after 0.1 seconds after each deployment. -
Add a Node-RED template node, and add the following HTML code, which reflects any changes in the
/worldmapend-point. Name this nodeDisplay.<iframe src="/worldmap" height=670 width=670></iframe> -
Add a Dashboard template node, and edit it as follows. Call this node
Map.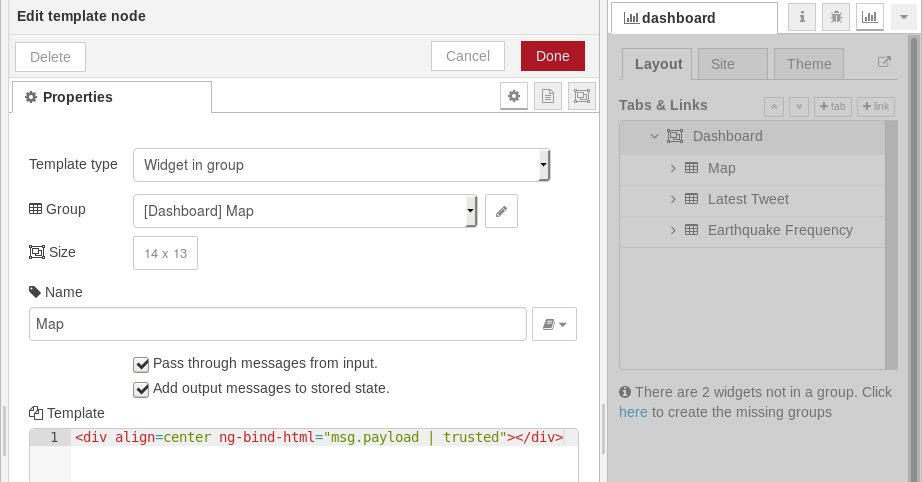
-
Add an inject node that will inject a payload with an empty JSON object (
{}) 5 seconds after deployment and every 60 minutes.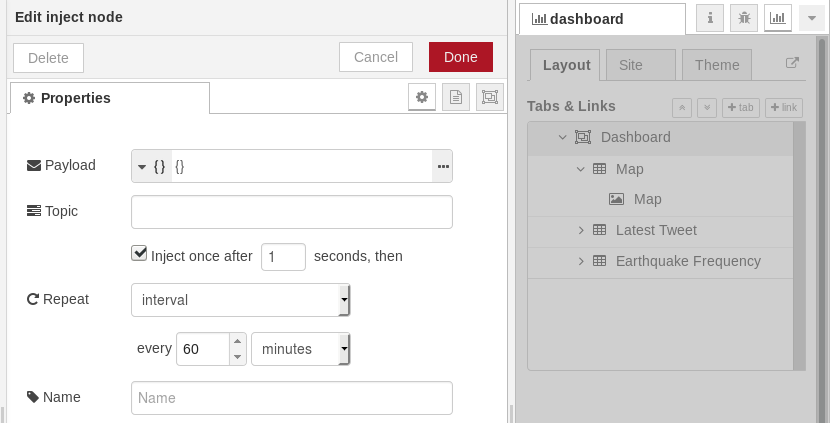
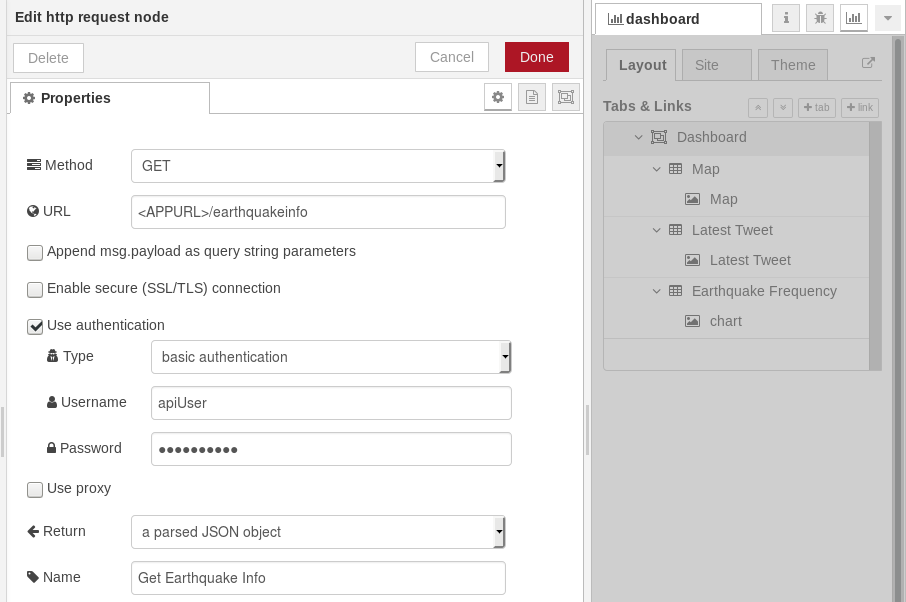
-
Connect the inject node to an HTTP request node that will call the web service we created earlier. The data that is returned will be displayed on a map through the worldmap endpoint, stored in a Cloudant database, and analyzed to plot a chart of earthquake frequency per region. Make sure that you edit the HTTP request node and replace <APPURL> with the URL of your Node-RED application and have Return set to a parsed JSON object. Name this node
Get Earthquake Info.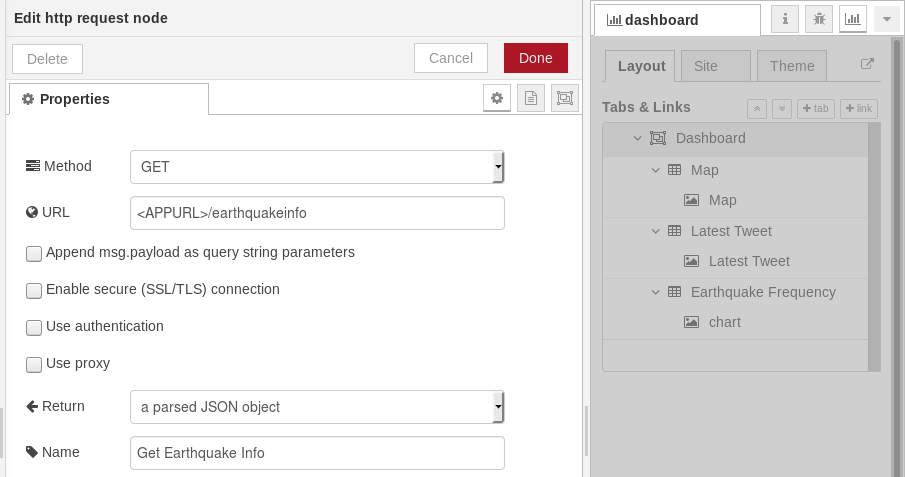
-
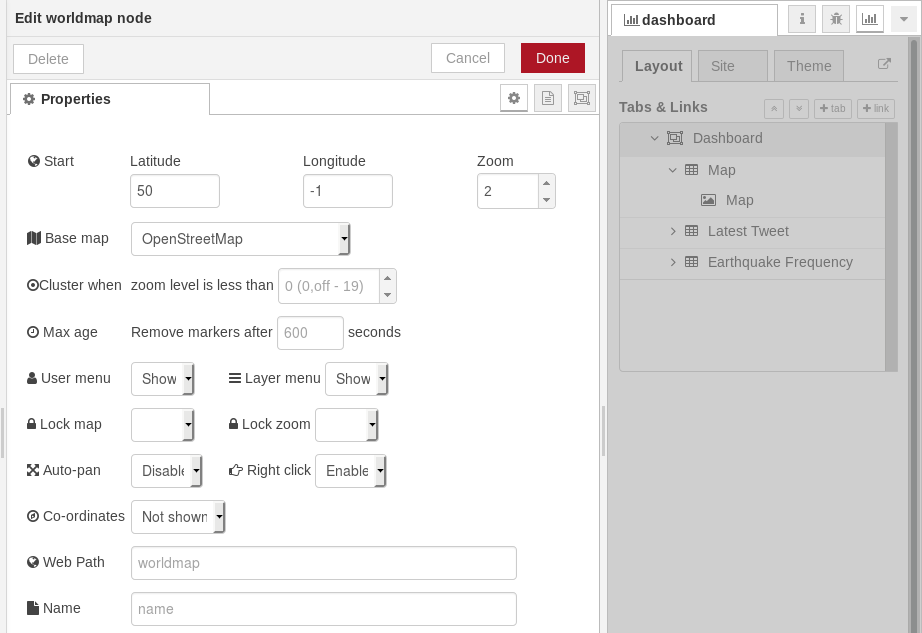
Connect a split node to the HTTP request node, which will split the output of returned to plot each of the point representing a location. Keep the configuration of the node as default. Also, connect the split node to the worldmap node to plot each point on the web map and edit the node as follows.
-
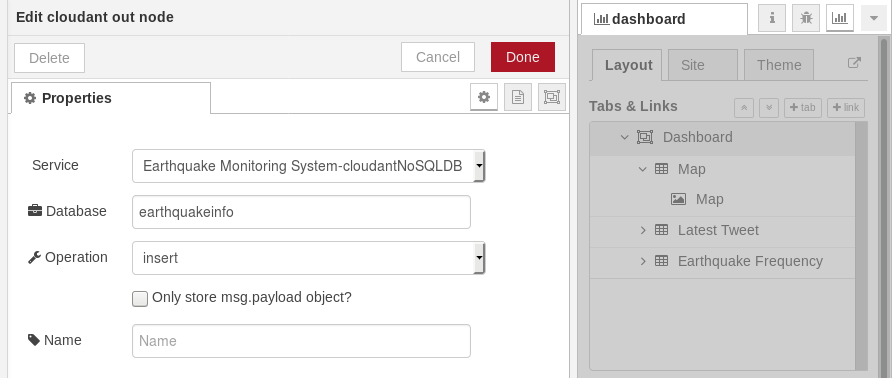
Since we mentioned that the points will be stored, connect a cloudant out node to the previously added HTTP request node, and configure it as shown below.
-
Now, in order to plot the line chart to look at the earthquake frequency per region, add a change node to the HTTP request node to filter out the region names. Add a rule to Set
msg.payloadto the JSONata expressionpayload.Region. Call this nodeFilter Regions.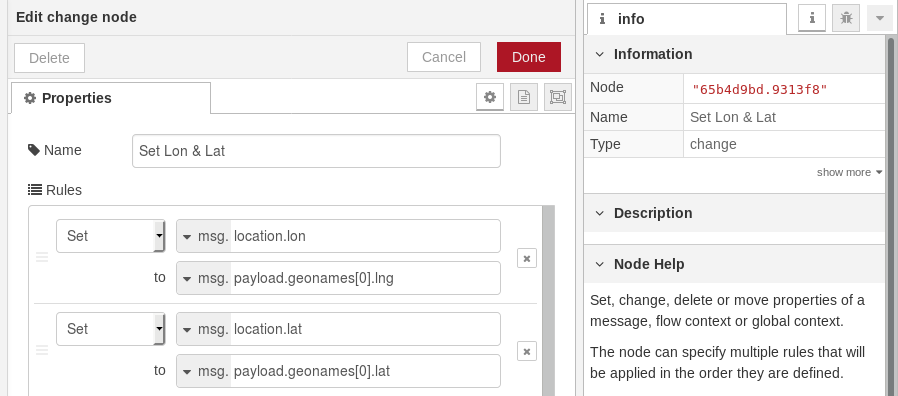
-
To the change node, connect a function node, which will be counting the number of earthquakes currently happening per region. In the function node, add the following javascript code. Call this node
Count.var arr = msg.payload; var counts = {}; for (var i = 0; i < arr.length; i++) { counts[arr[i]] = 1 + (counts[arr[i]] || 0); } msg.payload = counts; return msg; -
Add another function node, which will calculate the actual frequency and will put the data in a form that can be fed into a Dashboard chart node. Then, modify the number of outputs coming out of the function to
5. Name this nodeEarthquake Frequency. Use this javascript code.msg1 = {topic:"Africa", payload:msg.payload.Africa}; msg2 = {topic:"Americas", payload:msg.payload.Americas}; msg3 = {topic:"Asia", payload:msg.payload.Asia}; msg4 = {topic:"Europe", payload:msg.payload.Europe}; msg5 = {topic:"Oceania", payload:msg.payload.Oceania}; return [msg1, msg2, msg3, msg4, msg5]; -
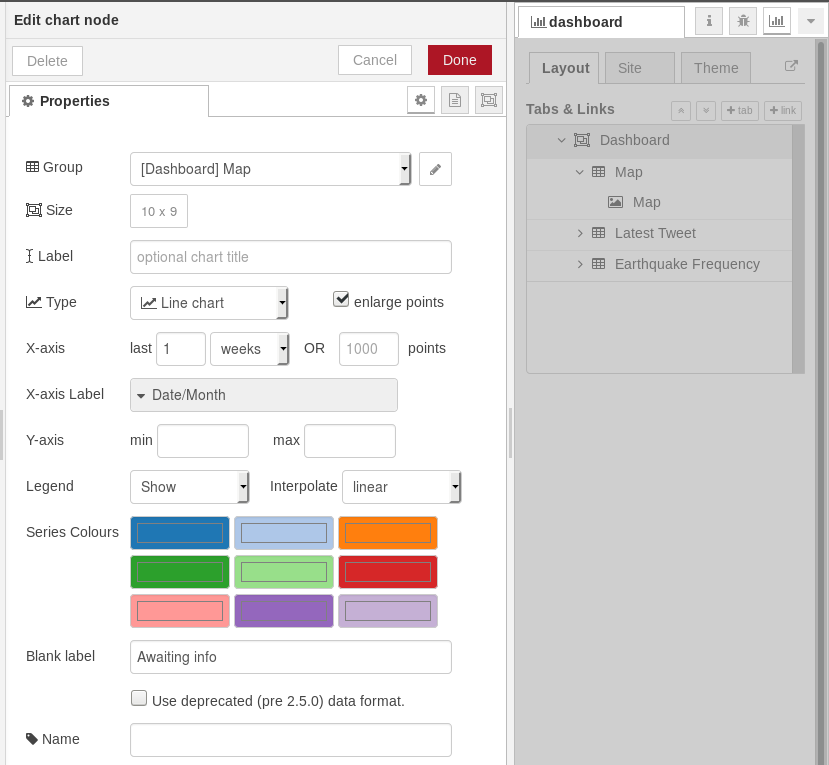
Connect the 5 outputs of the function node added in the previous step to a Dashboard chart node.
-
Edit the chart node, and set the node properties as follows.
-
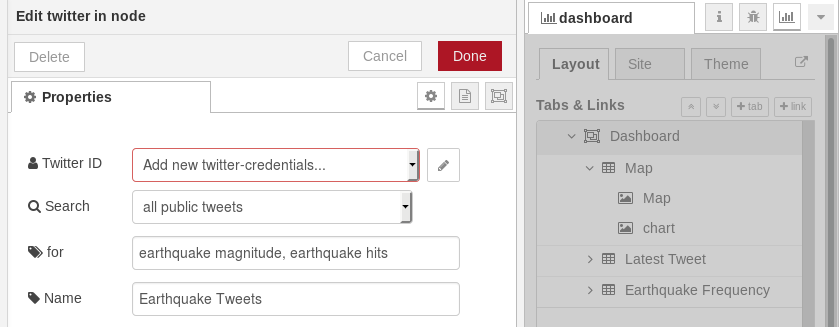
Add a twitter in node and configure the node to add new twitter-credentials config node. Follow the steps mentioned to obtain the consumer key and secret, and the access token and secret.
-
Search in all public tweets for earthquake magnitude, earthquake hits.
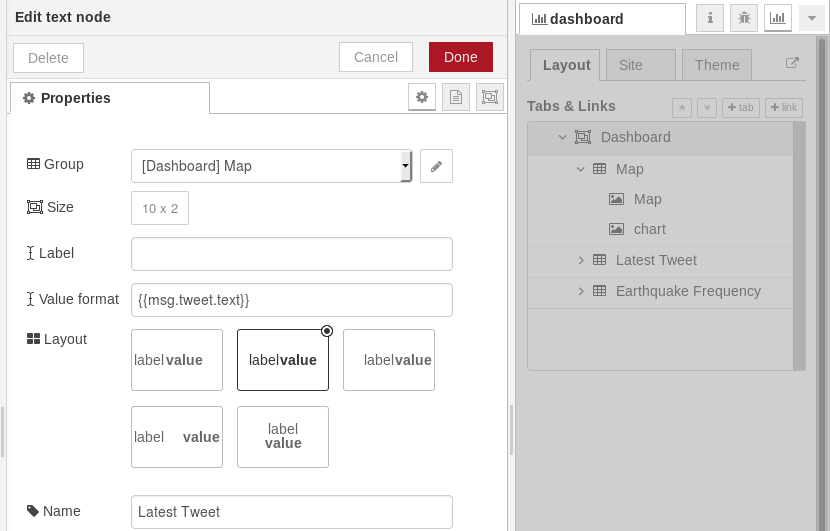
-
Connect the twitter in node to a Dashboard text node and configure it as follows.


After you clean up and organize your nodes, the flow will look something similar to the following.

If you open the dashboard by either going to _APPURL_/ui or clicking on the arrow icon, you'll see something similar to the following screen capture:

While you do not have to secure your web service, it is good practice to do so. I strongly encourage you to secure your Web APIs.
-
Go back to your application Overview page, scroll to the end of the page to find Continuous delivery section.
-
Click on View toolchain
-
Click on Eclipse Orion Web IDE to open the online editor.
-
Under Edit in the editor, go to bluemix-setting.js file.
-
Find the definition of the functionGlobalContext object.
-
Add the following javascript snippet before the functionGlobalContext object we added earlier to define a username and password for the API using basic authentication used to secure it.
httpNodeAuth:{ user: "apiUser" pass: "" } -
Get the password using bcrypt by going to your flow editor, and installing bcrypt node via Manage pallete.
-
In the same flow, add and connect an inject node to a bycrypt node, which you will connect to the debug node.

-
The inject will contain the password of type string into the bcrypt node (make sure the Action is set to Encrypt).
-
After injecting the password, copy the output of the debug node, and go back to bluemix-setting.js to add it to
pass(representing the API's password during Basic Authentication). -
Go to Git in the editor, and commit and push all changes.
-
Go back to the IBM Cloud Dashboard, and go to your application and wait for your application to finish deploying. You can check that by looking at Delivery Pipeline.
-
Go back to the Node-RED flow editor again to secure your API.
-
Go to the HTTP response node, enable Use authentication, select Type as basic authentication and enter the username and password you have defined (the password is not the output of the bcrypt node, but the string that was injected to the bcrypt node.
-
Deploy the changes.


The basic authentication will be applied to all the APIs that you define in your application.
Now that you have successfully implemented and deployed the application where you can monitor earthquakes in different regions, you are ready to explore the other different nodes that are available, including the IBM Watson nodes. In particular, give this tutorial a try: "Build a spoken universal translator using Node-RED and Watson AI services."