CONICS: COpy-Number analysis In single-Cell RNA-Sequencing
CONICS works with either full transcript (e.g. Fluidigm C1) or 5'/3' tagged (e.g. 10X Genomics) data!
The CONICS paper has been accepted for publication in Bioinformatics. Check it out here !
- CONICSmat - Identifying CNVs from scRNA-seq with only a count table (R tutorial)
- Identifying CNVs from scRNA-seq using aligned reads and a control dataset (advanced users)
- Integrating the minor-allele frequencies of point mutations (advanced users)
- Phylogenetic tree contruction
- Intra-clone co-expression networks
- Assessing the correlation of CNV status with single-cell expression
- False discovery rate estimation: Cross validation
- False discovery rate estimation: Empirical testing
CONICSmat is an R package that can be used to identify CNVs in single cell RNA-seq data from a gene expression table, without the need of an explicit normal control dataset. CONICSmat works with either full transcript (e.g. Fluidigm C1) or 5'/3' tagged (e.g. 10X Genomics) data. A tutorial on how to use CONICSmat, and a Smart-Seq2 dataset, can be found on the CONICSmat Wiki page [CLICK here].
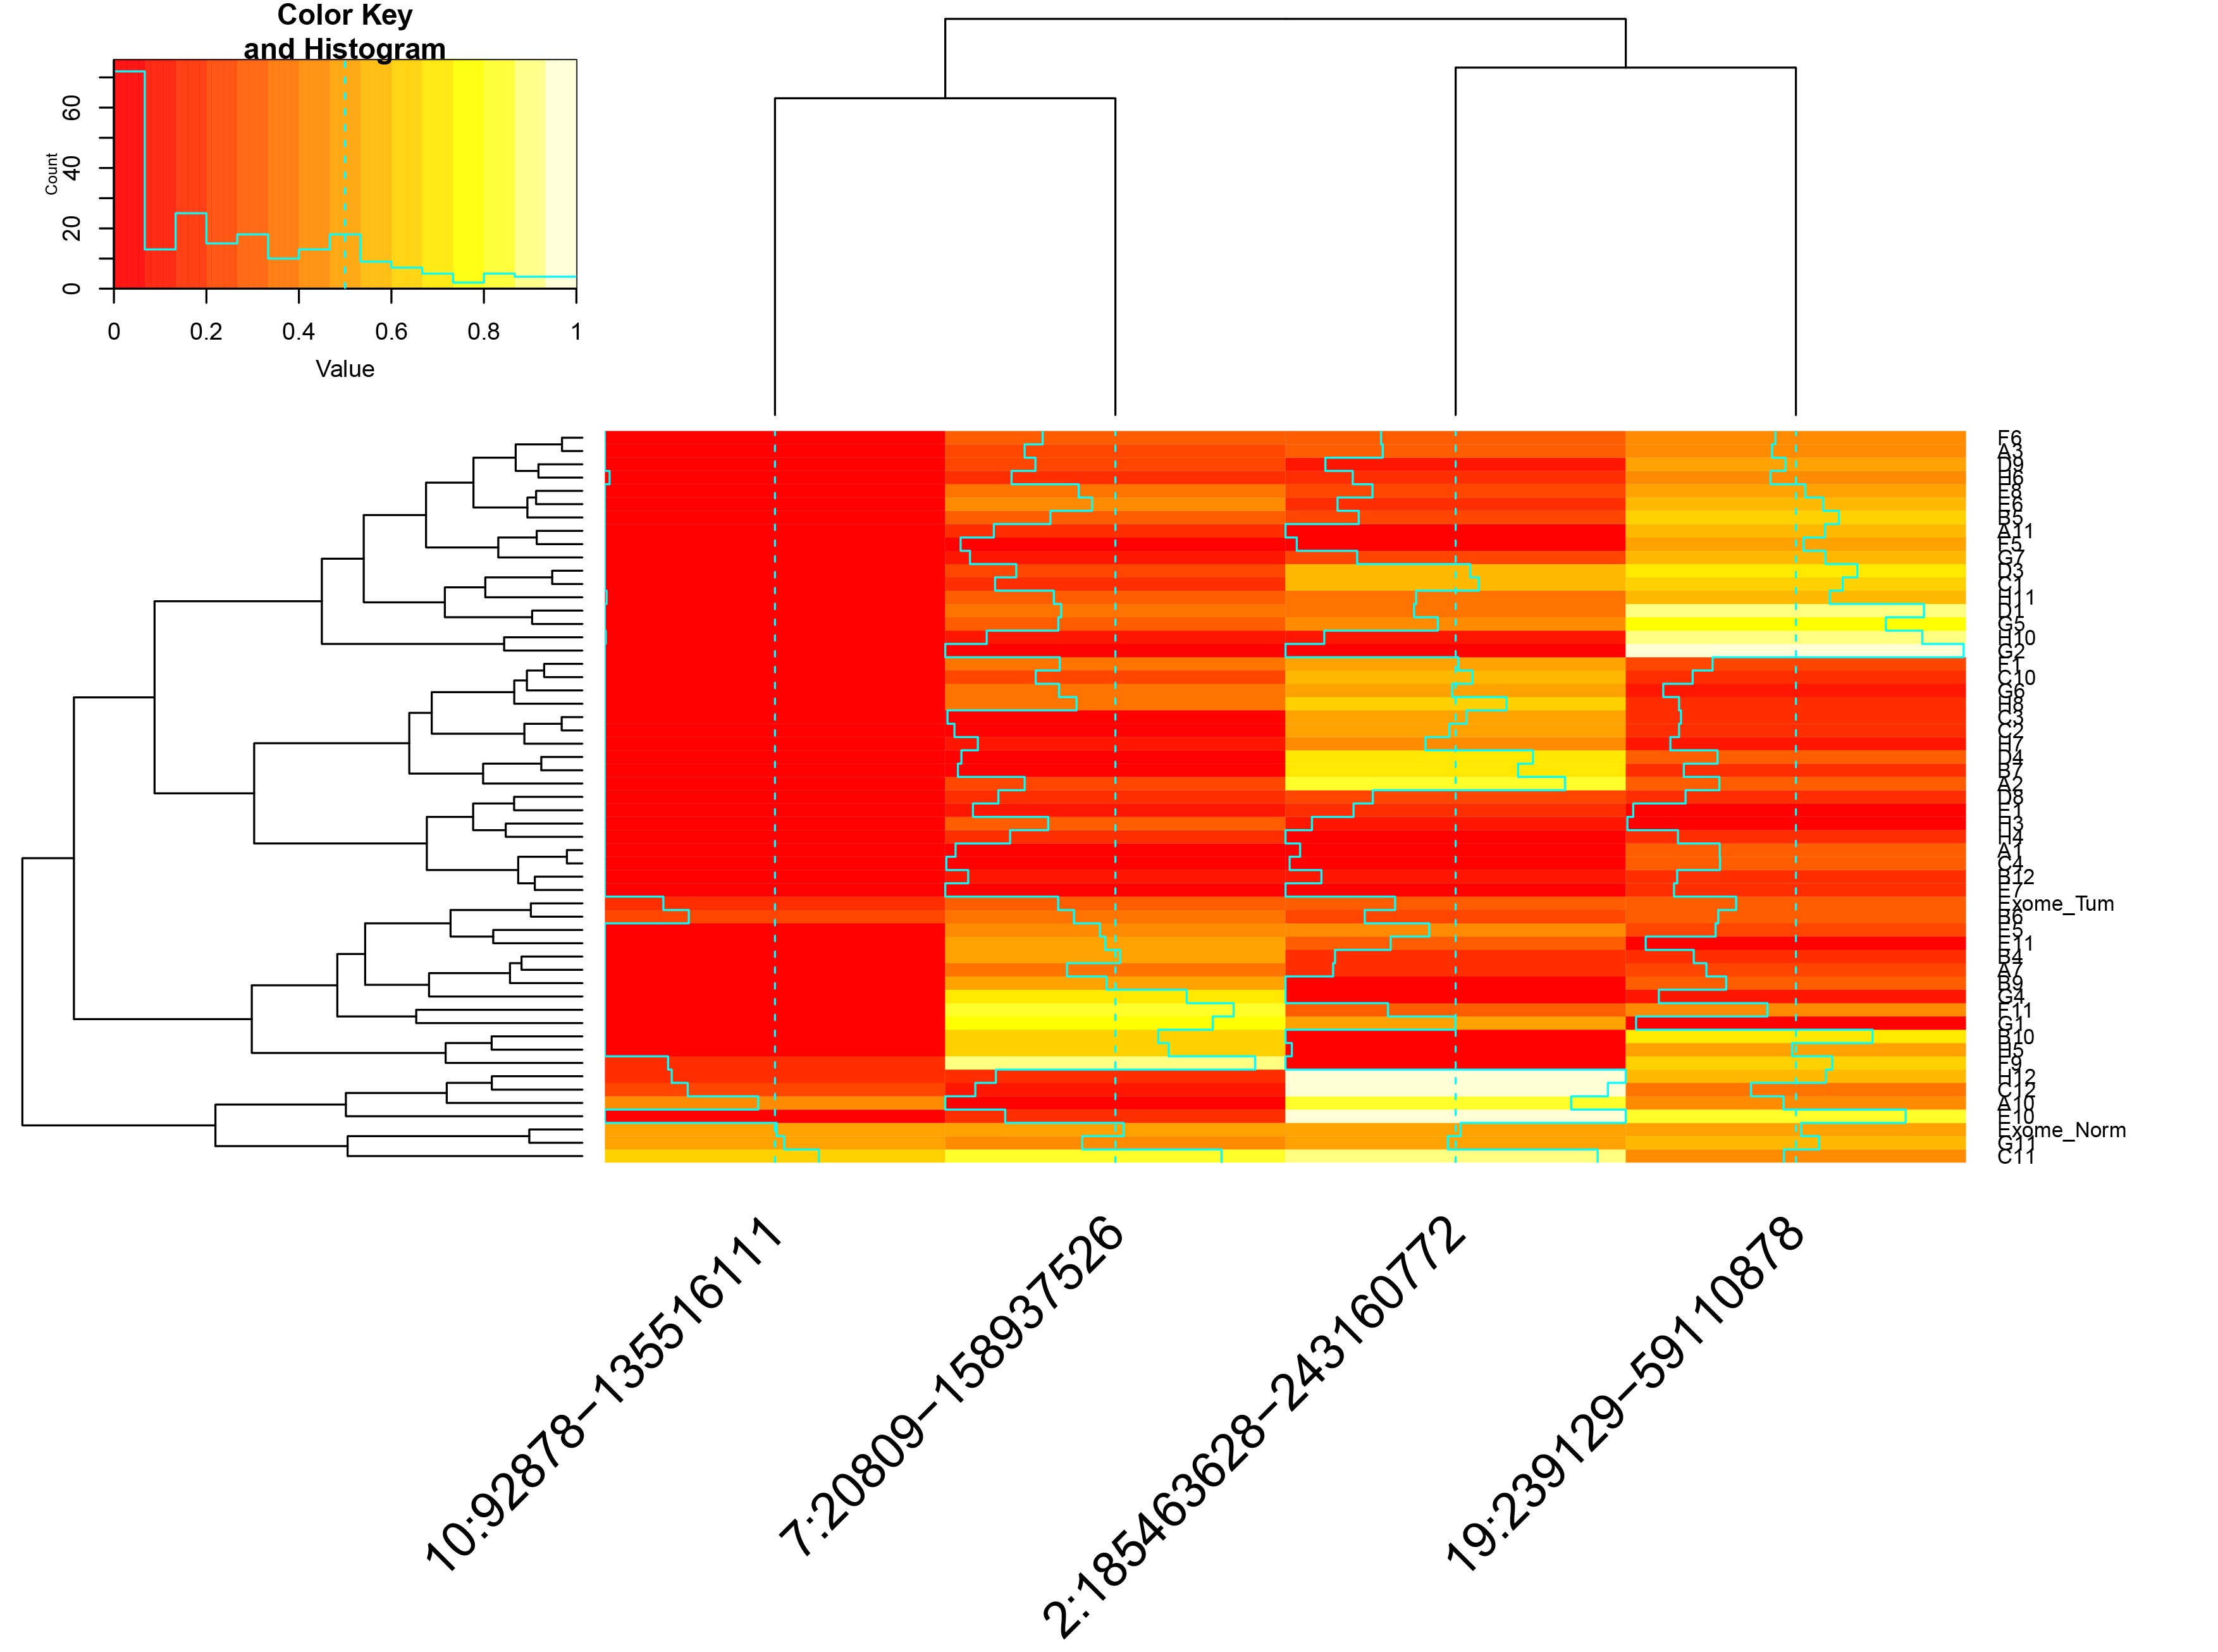
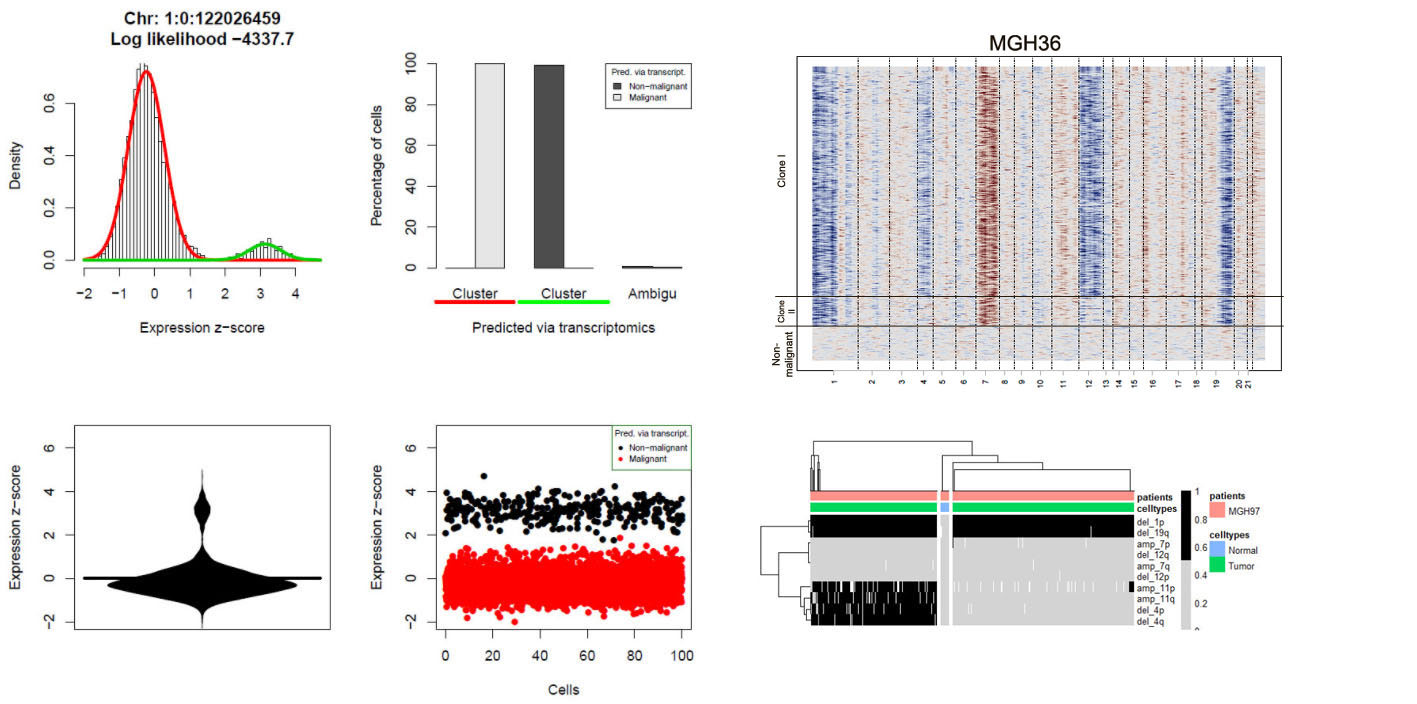 Visualizations of scRNA-seq data from Oligodendroglioma (Tirosh et al., 2016) generated with CONICSmat.
- Python and Perl
- beanplot
- samtools
- bedtools IMPORTANT: Bedtools >2.2.5 is needed in order to correctly calculate the coverage using CONICS.
- Two directories, the first containing the aligned scRNA-seq data to be classified by CNV status, and a second, containing aligned scRNA-seq data to be used as a control.
- A file containing the genomic coordinates of the CNVs in BED format.
Adjust CONICS.cfg to customize the following:
- Path to python/samtools/bedtools/Rscript
- Thresholds for mapping-quality and read-count
- FDR for CNV calling
A set of tumor cells from three glioblastoma patients and a normal brain control, as well as a file with genomic coordinate of large-scale CNVs are available here.
bash run_CONICS.sh [directory for tumor] [directory for normal] [.bed file for CNV segments] [base name]
-
[directory for tumor]: path to directory containing aligned bam files to be tested. Example glioblastoma data, used in the manuscript, can be obtained here.
-
[directory for normal]: path to directory containing aligned bam files to be used as a control. Example nonmalignant brain data, used in the manuscript, can be obtained here was used as an examples for the journal
-
[BED file for CNV segments]: tab-delimited bed file of CNV segments to be quantified.
[chromosome] [start] [end] [chromosome:start:end:CNV]Note: the 4th column of the file must have the exact format shown here:(Amp: amplification, Del: deletion)
7   19533   157408385   7:19533:157408385:Amp
9   19116859    32405639    9:19116859:32405639:Del
- [base name] : base name for output directory
All output files will be located in the directory output[base name]_.
- incidenceMatrix.csv: matrix of presence/absence for all CNVs, in individual cells
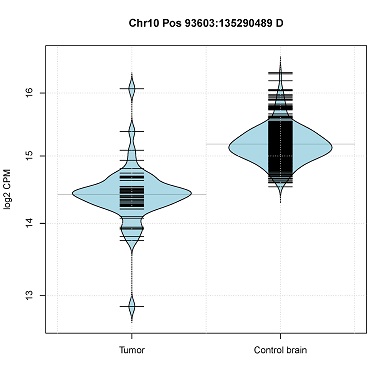
- Read-count distribution in CNV segments. (violin plot)
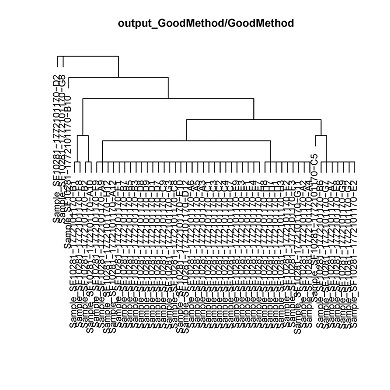
- Hierarchical clustering of the single cells by CNV status.
Regions of copy-number alteration will show a drop in the frequency of reads quantifying the minor allele. Averaged over large regions of copy-number alteration, this provides an additional metric to increase confidence in single-cell CNV-calls.
- Python and R
- bam-readcount
- gplots and ggplot2
- One directory containing the aligned tumor scRNA-seq data to be classified
- Two variant VCF files from exome-seq of (blood) control and tumor tissue, eg generated with the GATK toolkit.
- A file containing the genomic coordinates of the CNVs in BED format.
Adjust CONICS.cfg to customize the following:
- Path to python/bam-readcount/Rscript
- Path to genome which reads were aligned to (FASTA format)
bash run_BAf_analysis.sh [directory for tumor] [VCF file for normal exome-seq] [VCF file for tumor exome-seq] [BED file for CNV segments] [base name]
-
[directory for tumor]: path to directory containing aligned bam files to be tested. Example glioblastoma data, used in the manuscript, can be obtained here.
-
[VCF file for normal exome-seq]: Vcf file containing mutations for a control exome-seq, e.g. from blood of the patient. This file can be generated with tools like GATK toolkit.
-
[VCF file for tumor exome-seq]: Vcf file containing mutations detected in exome-seq of the tumor. This file can be generated with tools like GATK toolkit.
-
[BED file for CNV segments]: tab-delimited bed file of CNV segments to be quantified.
-
[base name] : base name for output directory
All output files will be located in the directory output[base name]_
- _germline-snvs.bed: BED file containing position and BAFs from Exome-seq, generated in step 1.
- _af.txt: TAB separated table containing the counts for the A allele at each locus in each cell, generated in step 2
- _bf.txt: TAB separated table containing the counts for the B allele at each locus in each cell, generated in step 2
- baf_hist.pdf Hierarchical clustering of the average B allele frequency in each of the loci altered by copy number for each cell, generated in step 3
CONICS can generate a phylogenetic tree from the CNV incidence matrix, using the Fitch-Margoliash algorithm. Other phylogenetic reconstruction algorithms can be applied, using the incidence matrix as a starting point.
Adjust Tree.cfg to change the following.
- Path to Rscript
- Path to Rphylip
- Before running, set the path to Phylip in Tree.cfg file.
bash run_Tree.sh [CNV presence/absence matrix][number of genotypes] [base name for output file]
- [CNV presence/absence matrix]: .incidenceMatrix.csv files.
- [number of genotypes]: the number of genotypes to model
- [base name] : base name for output directory
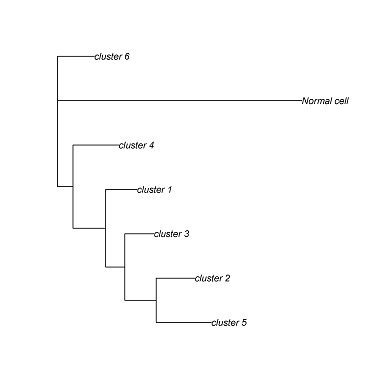
cluster.pdf (phylogenetic trees) and cluster.txt will be generated in the output directory. Each leaf corresponds to a clusters of cells with a common genotype. Cluster assignments for each cell will be in cluster.txt.
cluster_1  D12,E10,F9,G3,A12,C8,C9,A3,A5,A6,C3,C2,C1,C7,H12,C4,D8,D9,A9,E4,E7,E3,F1,E1,B5,B7,E9,B3,D7,D1
cluster_2  E8,G7,G9,A7,G2,B6,E2
cluster_3  H3,A2,A4,H8,G11,F2,F3,H1,H7
cluster_4  A10,B2
cluster_5  C5
cluster_6  F8,B1
CONICS can construct the local co-expression network of a given gene, based on correlations across single cells.
Adjust CorrelationNetwork.cfg to configure the following:
- Path to Rscript
- ncore: Number of cores (default: 12)
- cor_threshold: Starting threshold to construct the co-expression network (default: 0.9)
- min_neighbours: How many direct neighbours of gene of interest should be analyzed (default: 20)
- minRawReads: How many raw reads should map to a gene for it to be included (default: 100)
- percentCellsExpressing: Percentage (0.15 =15%) of cells expressing a gene for it to be included (default: 0.15)
- minGenesExpr: How many genes should be expressed in a cell for it to be included (default: 800)
- depth: How deep should the gene analysis search. (2=only direct neighbor genes would be considered) (default: 2)
bash run_CorrelationNetwork.sh [input matrix] [centered gene] [base name]
- [input matrix]: tab-delimited file of read counts for each gene (rows), for each cell (columns).
- [centered gene]: a target gene of which neighbor genes are analyzed.
- [base name] : base name for output directory
All the output files will be located in output.
- [correlstion_threshold]_[gene_name].txt : co-expression network
- [gene_name]corMat.rd: Rdata containing the adjusted correlation matrix
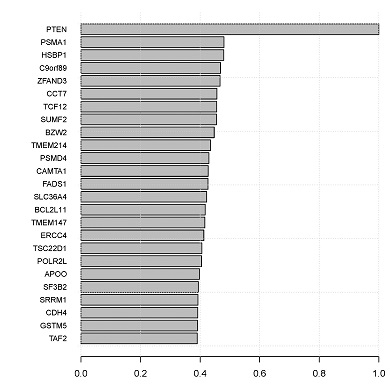
- topCorrelations.pdf: bar graph of top correlations.
Adjust CompareExomeSeq_vs_ScRNAseq.cfg to set the following:
- Path to Rscript
- window size for assessing CNV status
bash run_compareExomeSeq_vs_ScRNAseq.sh [matrix for read counts] [base name for output file]
-
[matrix for read counts]: tab-delimited file of the number of mapped reads to each gene in the DNA sequencing and in scRNA-seq. Genes on each chromosome should be ordered by their chromosomal position.
[gene] [chromosome] [start] [#read in DNA-seq(normal)] [#read in DNA-seq(tumor)] [#read in scRNA-seq(normal)] [#read in scRNA-seq(tumor)]- example
DDX11L1   1   11874   538   199   5   0
WASH7P    1   14362   4263   6541   223   45
- [base name] : base name for output directory
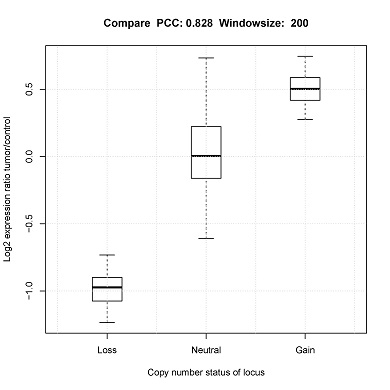
Compare[window_size].pdf_ (Box plot) will be generated in the output directory.
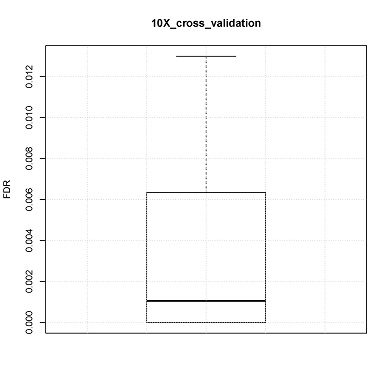
CONICS can estimate false discovery rate via 10-fold cross-validation, using the user-supplied control scRNA-seq dataset. For example, in the manuscript cross validation was performed using normal brain controls.
Adjust 10X_cross_validation.cfg to set the following:
- Paths to python/samtools/bedtools/Rscript
- Thresholds for mapping-quality and read-count.
- FDR for CNV calling
bash run_10X_cross_validation.sh [directory for control scRNA-seq] [.bed file containing CNV segments] [base name]
-
[directory for test]: path to directory containing the aligned BAM files of the scRNA-seq control data.
-
[.bed file for CNV segments], [base name] : same as described in run_CONICS.sh ;
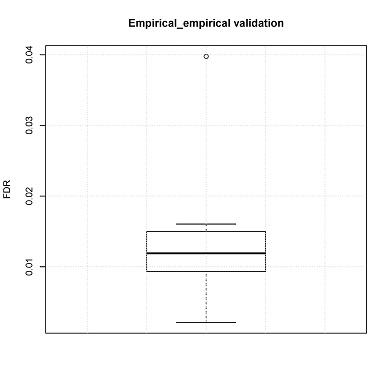
Box plot of 10 FDRs resulting from each pooled sample would be generated (boxplot.pdf) in the output directory.
FDRs can also be estimated by empirical testing. In the manuscript, the number of false positive CNV calls was calculated using a non-malignant fetal brain dataset. These data are independent from the training set
Adjust Empirical_validation.cfg to change the following:
- Paths to python/samtools/bedtools/Rscript
- Thresholds for mapping-quality and read count
- FDR for CNV calling
bash run_empirical_validation.sh [directory for train] [directory for test] [.bed files for CNV segments] [base name]
-
[directory for train]: path to directory containing aligned bam files of scRNA-seq data used as a control to call CNVs
-
[directory for test]: path to directory containing aligned bam files of scRNA-seq data known not to have CNVs, used as a gold standard.
-
[BED file for CNV segments] : same as described in run_CONICS.sh
Box plot of FDRs will be generated (boxplot.pdf) in the output directory.
