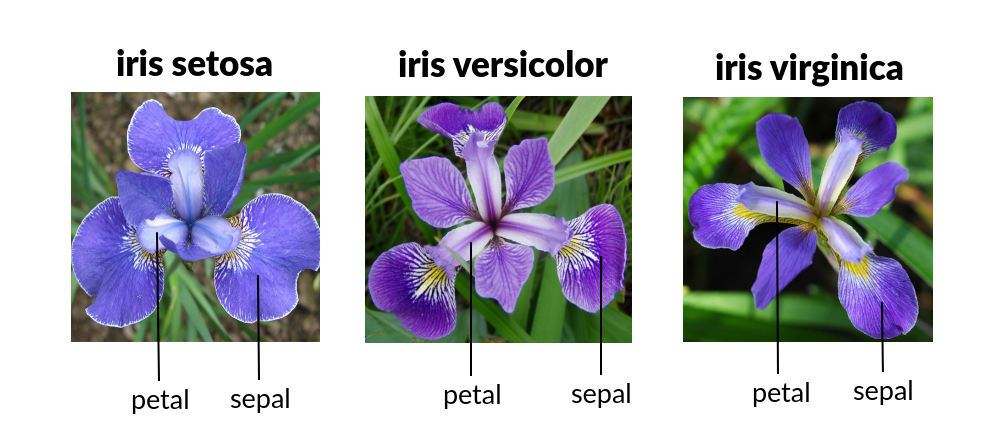
Iris
Dataset snapshot
Project Purpose
- In this project, you'll build a Data Web App to provide actionable insights and data driven recommendations for analyzing flowers profile and increasing productivity levels for Botanic field team
External user’s goal
- The Data Web App stakeholders (Special Flower divsion team) are interested to understand how each flower's species differ from each other and a tool to speedup species recognition.
Data Web App owner's goal
- The goal of this Data Web App is to help Botanic Garden to transform into a data driven organization.
Business Requirements
- As a Data Analyst from Botanic Garden, you are requested by Special Flower division to develop a system capable to distinguish among 3 distinct Iris species - Setosa, Versicolour and Virginica. Their next field mission at XYZ forest, which is officialy declared as contaminated area and is in the middle of nowehere. The team will harvest the flowers and store on boxes, but each box should have 1 specie type. The mission will happen in 10 days from today, and will take in total 25 days.
- 1 - We want to study how flowers' sepal and petal measurements differ across species.
- 2 - We are interested to recognize the flower species based on its instant petal and sepal measurement
Rationale to map the business requirements to the Data Visualizations and ML tasks
-
Business Requirement 1: Data Visualization
- We create a Pairplot colored by Species; 3D scatter plot colored by Species and a Correlation Heatmap
-
Business Requirement 2: Classification
- We will build a classifier (ClfIrisSpecies) to predict flower species based on the sepal and petal measurement.
- Train data - label: Species ; features: all other variables
- We will build a classifier (ClfIrisSpecies) to predict flower species based on the sepal and petal measurement.
Hypothesis
- We assume that setosa is easily distinguished from the other species
- We expect to validate that in the pairplot
- In our strategic studies, it is indicated that setosa and versicolor have roughly similar level for sepal, event though is possible to distinguish quite easily.
- We expect to validate that in the pairplot
- It is assumed that petal (both length and width) is a good predictor to determine the species
- The heatmap correlation may give some indication. The Feature Selection step at ML pipeline tells us the main predictors.
ML Business Case
ClfIrisSpecies
-
We will create ML model to predict what is the flower species based on sepal and petal measurements. It is a 3-class, single-label, classification model: 0 (Setosa), 1 (Versicolour) and 2 (Virginica).
-
Our ideal outcome is to provide Special Flowers botanic team a intelligent solution to speed up species diagnostic during the mission. The field operator will measure, with a ruler or something, the petal and sepal and will feed the App.
-
The success metrics are:
- 97% overall accuracy in the testing set.
- 94% overall accuracy in live data. We will know the actual values 24h after the boxes arrive back to Botanic garden.
- The ML model is considered a failure if Setosa species' Precision and Recall is not 100%, both at train and test sets. This species cant be mixed with other species under no circunstance.
-
The output is defined as species class prediction based on flower measurements, it will be displayed into the App UI. The field operator will see the prediction and once is happy, will save locally in the app: the flower measurement, prediction and unique number id for that prediction (this is done automatically). There are not latency requirements. The ML model needs only inputs from field operator. Once the operator arrives back at botanic garden, will transfer the files to the main system / database.
-
The training data to fit the model come from Botanic Garden database. There are, in total, 150 records of all Iris flowers with petal and sepal measurments and its correspondent species. Botanic Garden warranties the measurments are accurate and free of any bias or error.
-
Heuristics: If we didnt use ML, an alternative option could be to take a flower DNA sample and analyze on the field which species that sample belong, but this may take 3h to be done.
Streamlit App User Interface
Page 1: ML UI
- User Interface with inputs (flower petal and sepal levels) as numerical fields and prediction as a statement, indicating the predicted species class and the probability of each species.
Page 2: Data Visualization
- Pairplot colored by species
- 3D scatter plot colored by species
Page 3: ML model: ClfIrisSpecies
- The ML pipeline is evaluated on train and test set.
Django App User Interface
- It contains Page 1 and Page 2 from Streamlit App User Interface

