./setup.sh
-
What does this script do ?
- install dependencies
- move the dht_exporter.service to systemd/system
- enable and start the service
-
you can check if the metrics are being reported properly by hitting
PI_IP:8001/metrics -
You should see the metrics in the response
# TYPE dht_temperature gauge
dht_temperature{room="office_room"} 26.4
# HELP dht_humidity Relative Humidity in percent
# TYPE dht_humidity gauge
dht_humidity{room="office_room"} 39.4
- Before starting up prometheus make sure to update the PROMETHEUS_IP in the prometheus/targets.json file with the IP of the raspberry pi where the prometheus exporter is running
./docker_monitoring.sh
- After both of them are running add the prometheus instance as a datasource in grafana.
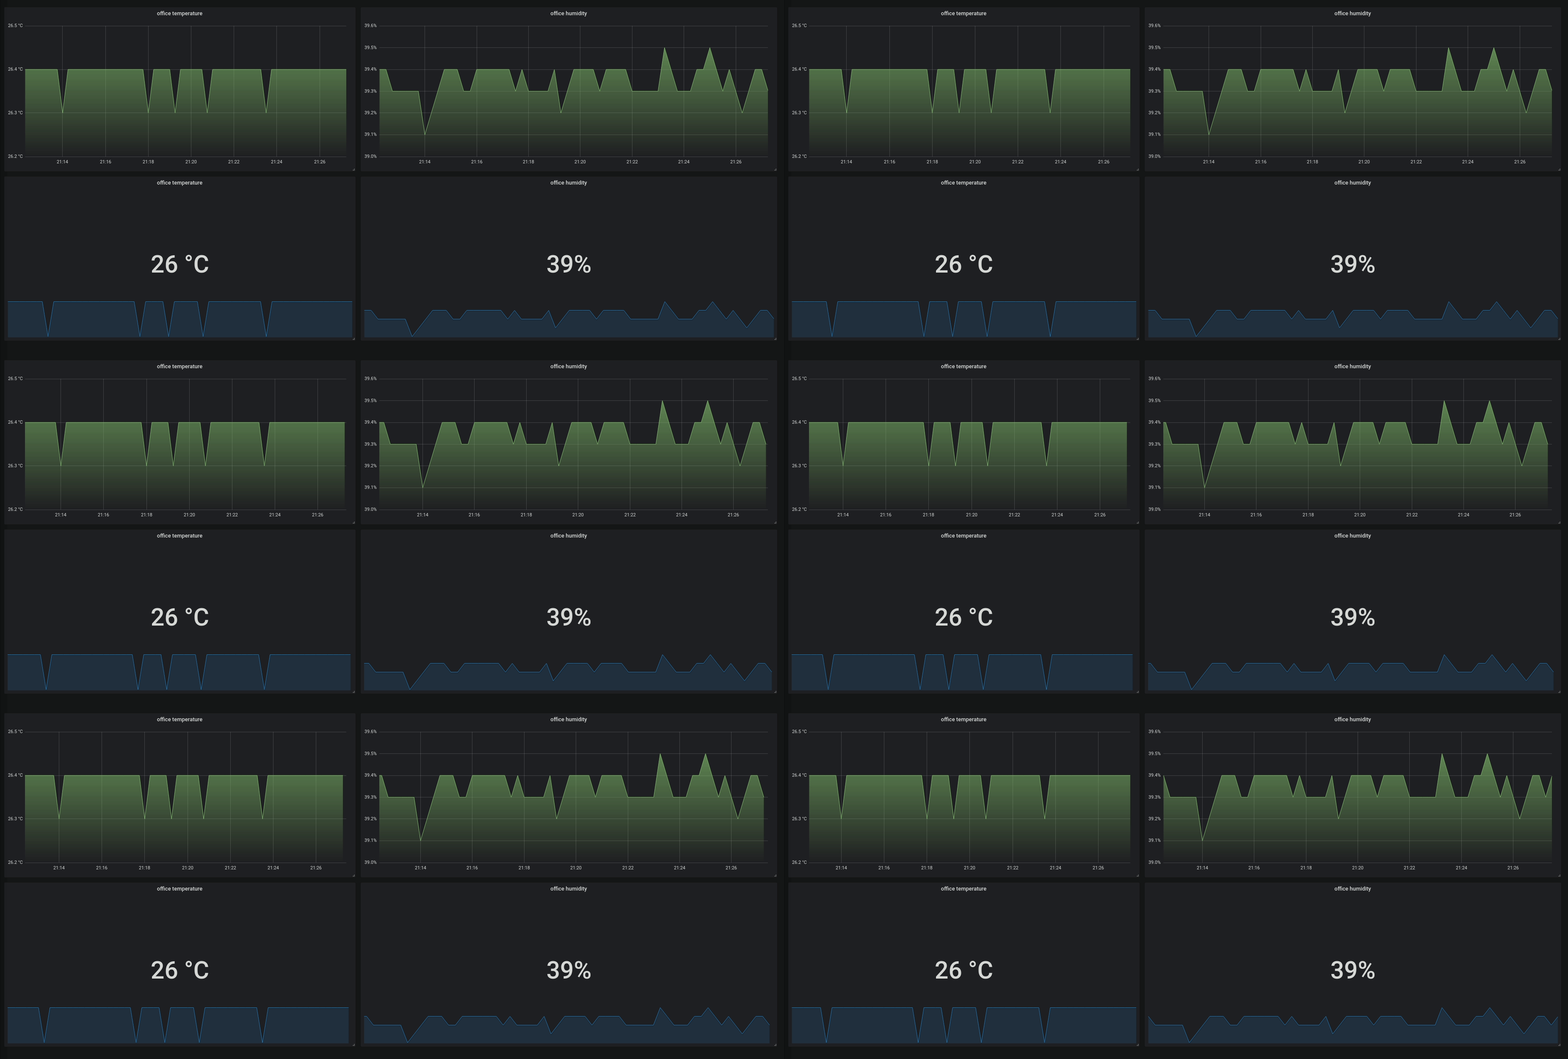
- Then you should be able to create graphs using those metrics

