- The project now has a domain name too: sustainableeateries.com/!
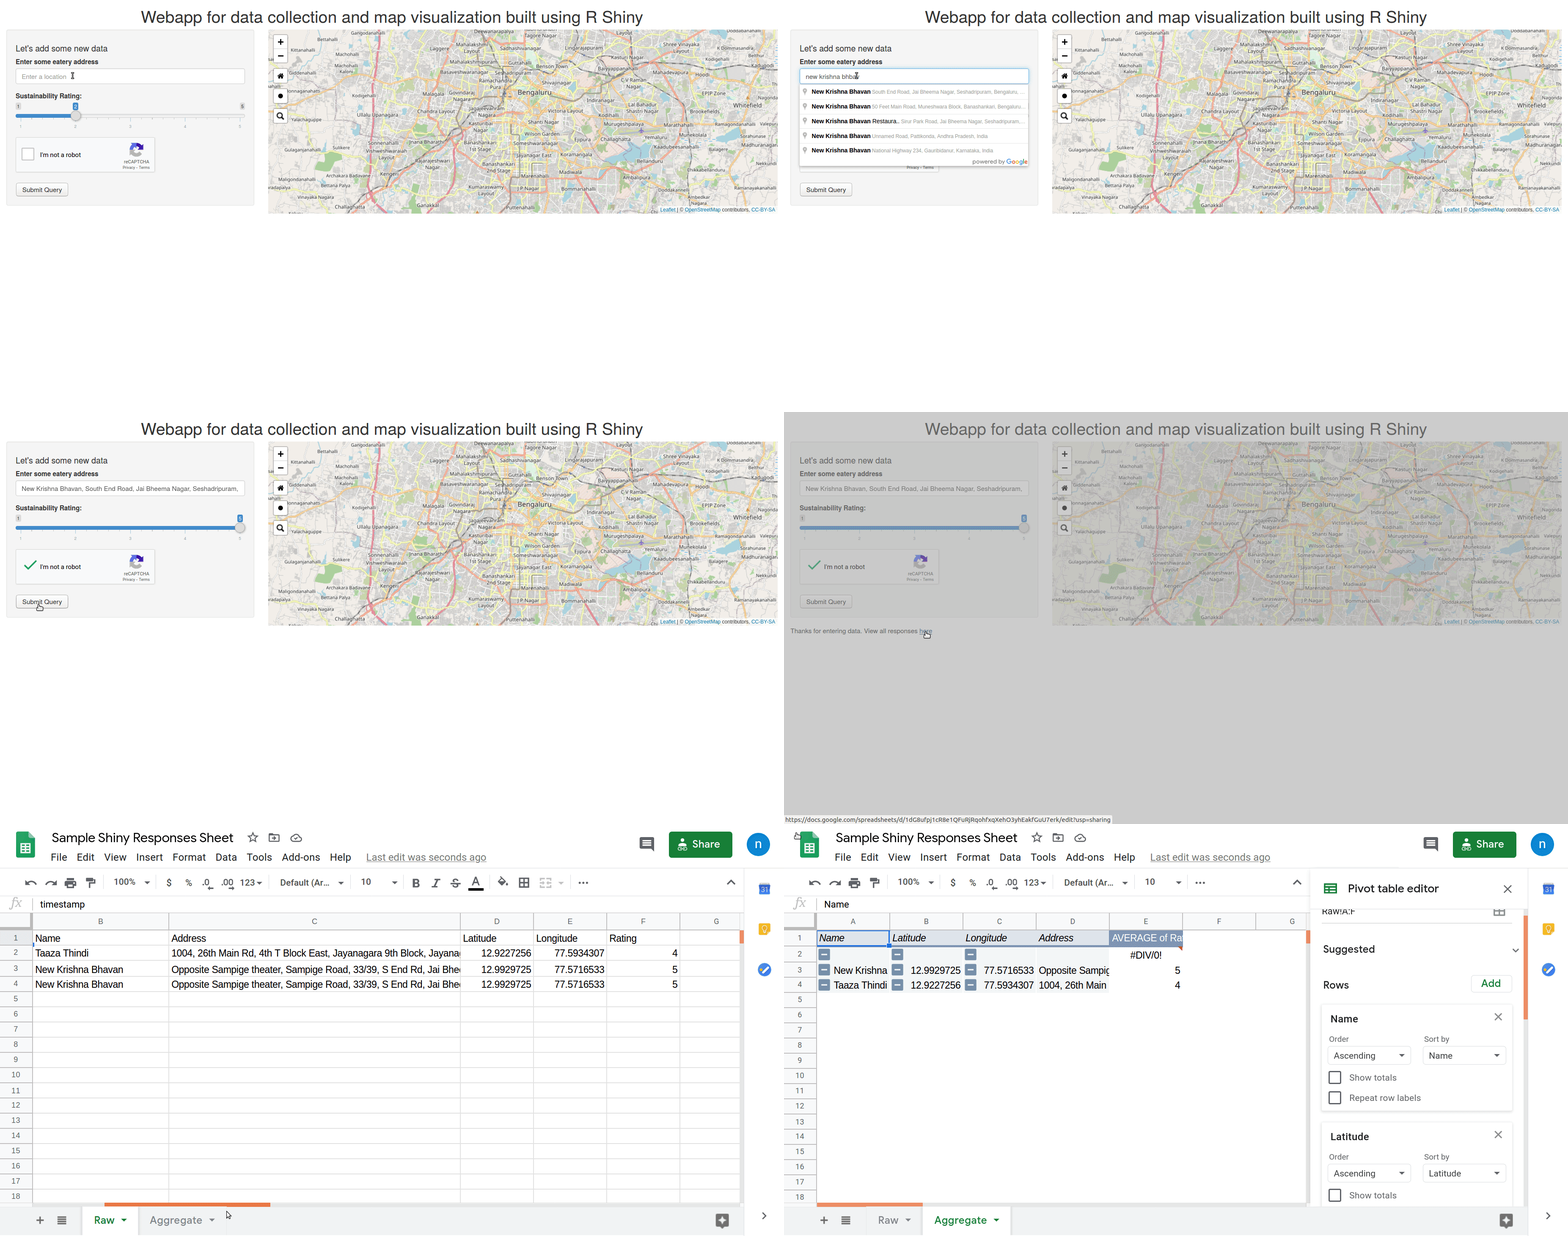
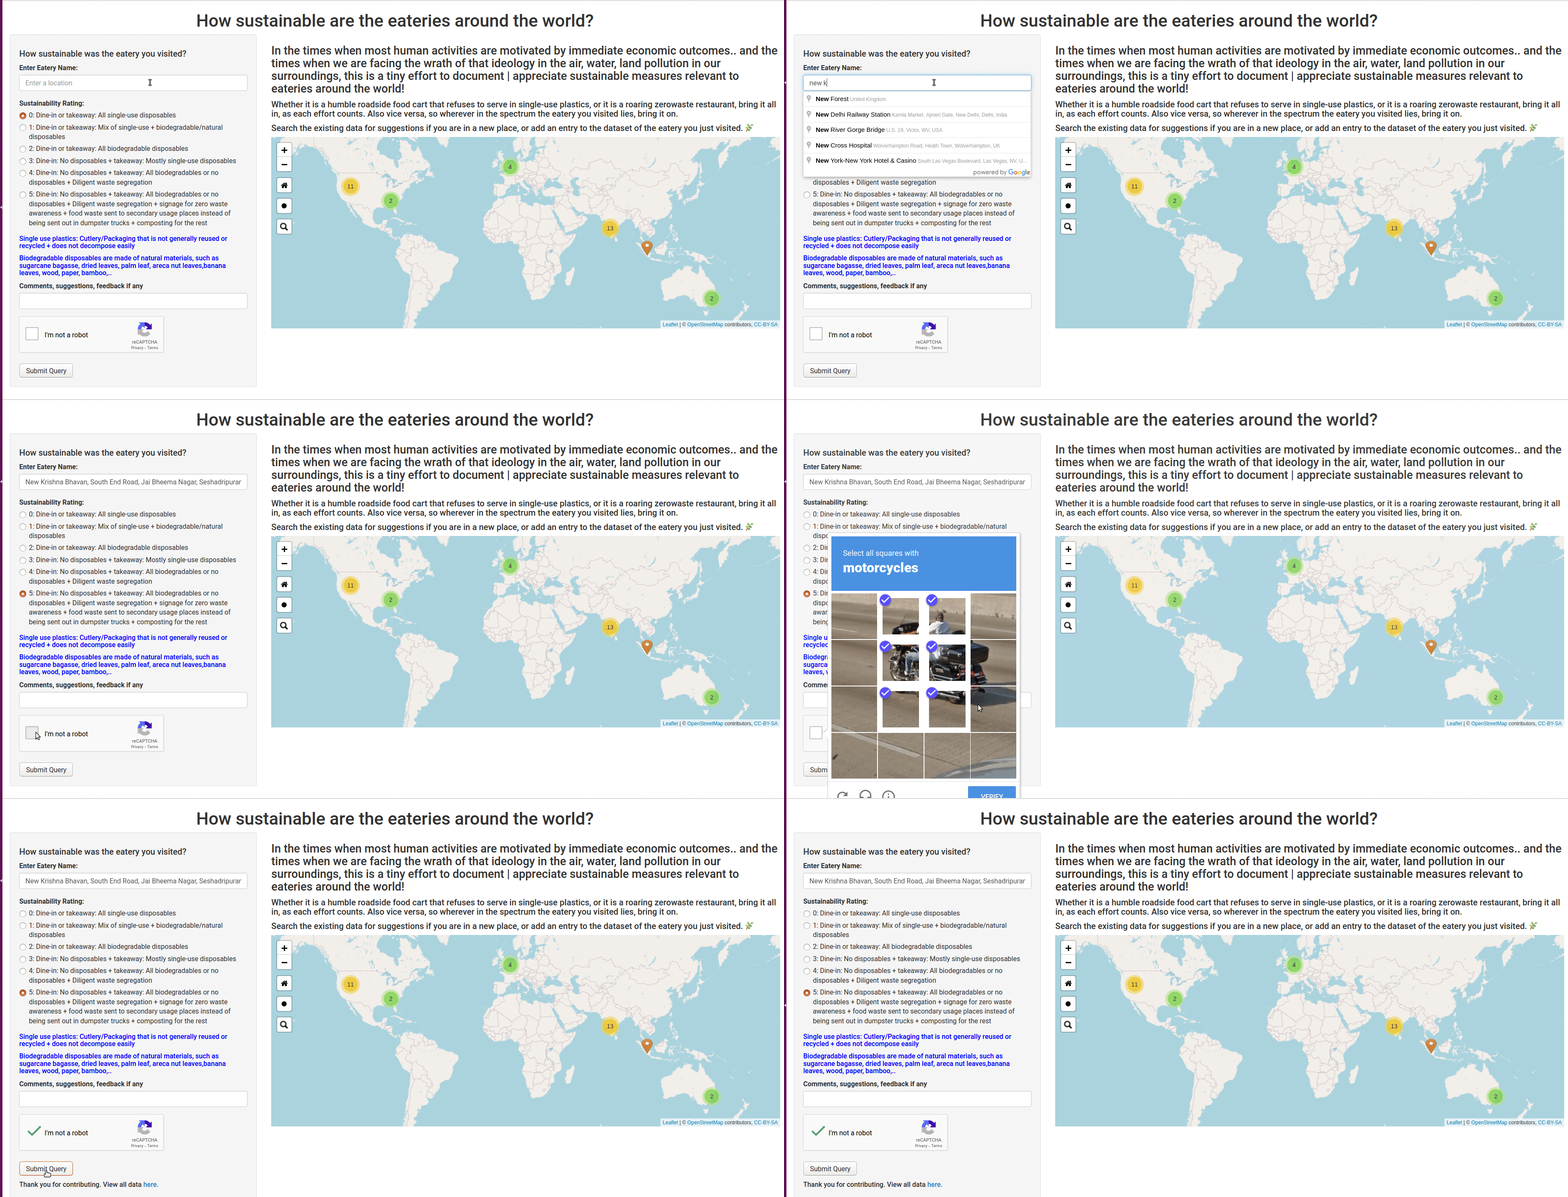
This repo contains the code to make a webapp using R Shiny with the following features:
- Form that feeds data to google sheets
- Use of Google Maps APIs in the form fields (autocomplete, geocoding)
- Leaflet to plot data from sheets: + Clusters for larger data + Searching through data + Marker colors by variables
- Recaptcha for security
Stepwise building of the webapp has been explained in this blog post.
Steps to get the code running:
- If you require any google maps api keys, then make a google maps account and generate the keys and enter them in the required locations in the code.
- If you use googlesheets for data entry, then make a .secret folder in the same directory as the app file and then force authentication once for the project to make sure the token is cached there.
- If you require recaptcha, then generate your keys (site key and secret key) from https://www.google.com/recaptcha/about/
- Generate a google sheet to store the data. (Sample data sheet)
- Run the app.
- View if the data is being filled correctly.
Additionally, if you would like to contribute data about how sustainable are eateries around you, check the webapp live at http://sustainableeateries.com/
I am also looking for collaborators for this project to work on some more features so do reach out.
Adios! ✨

