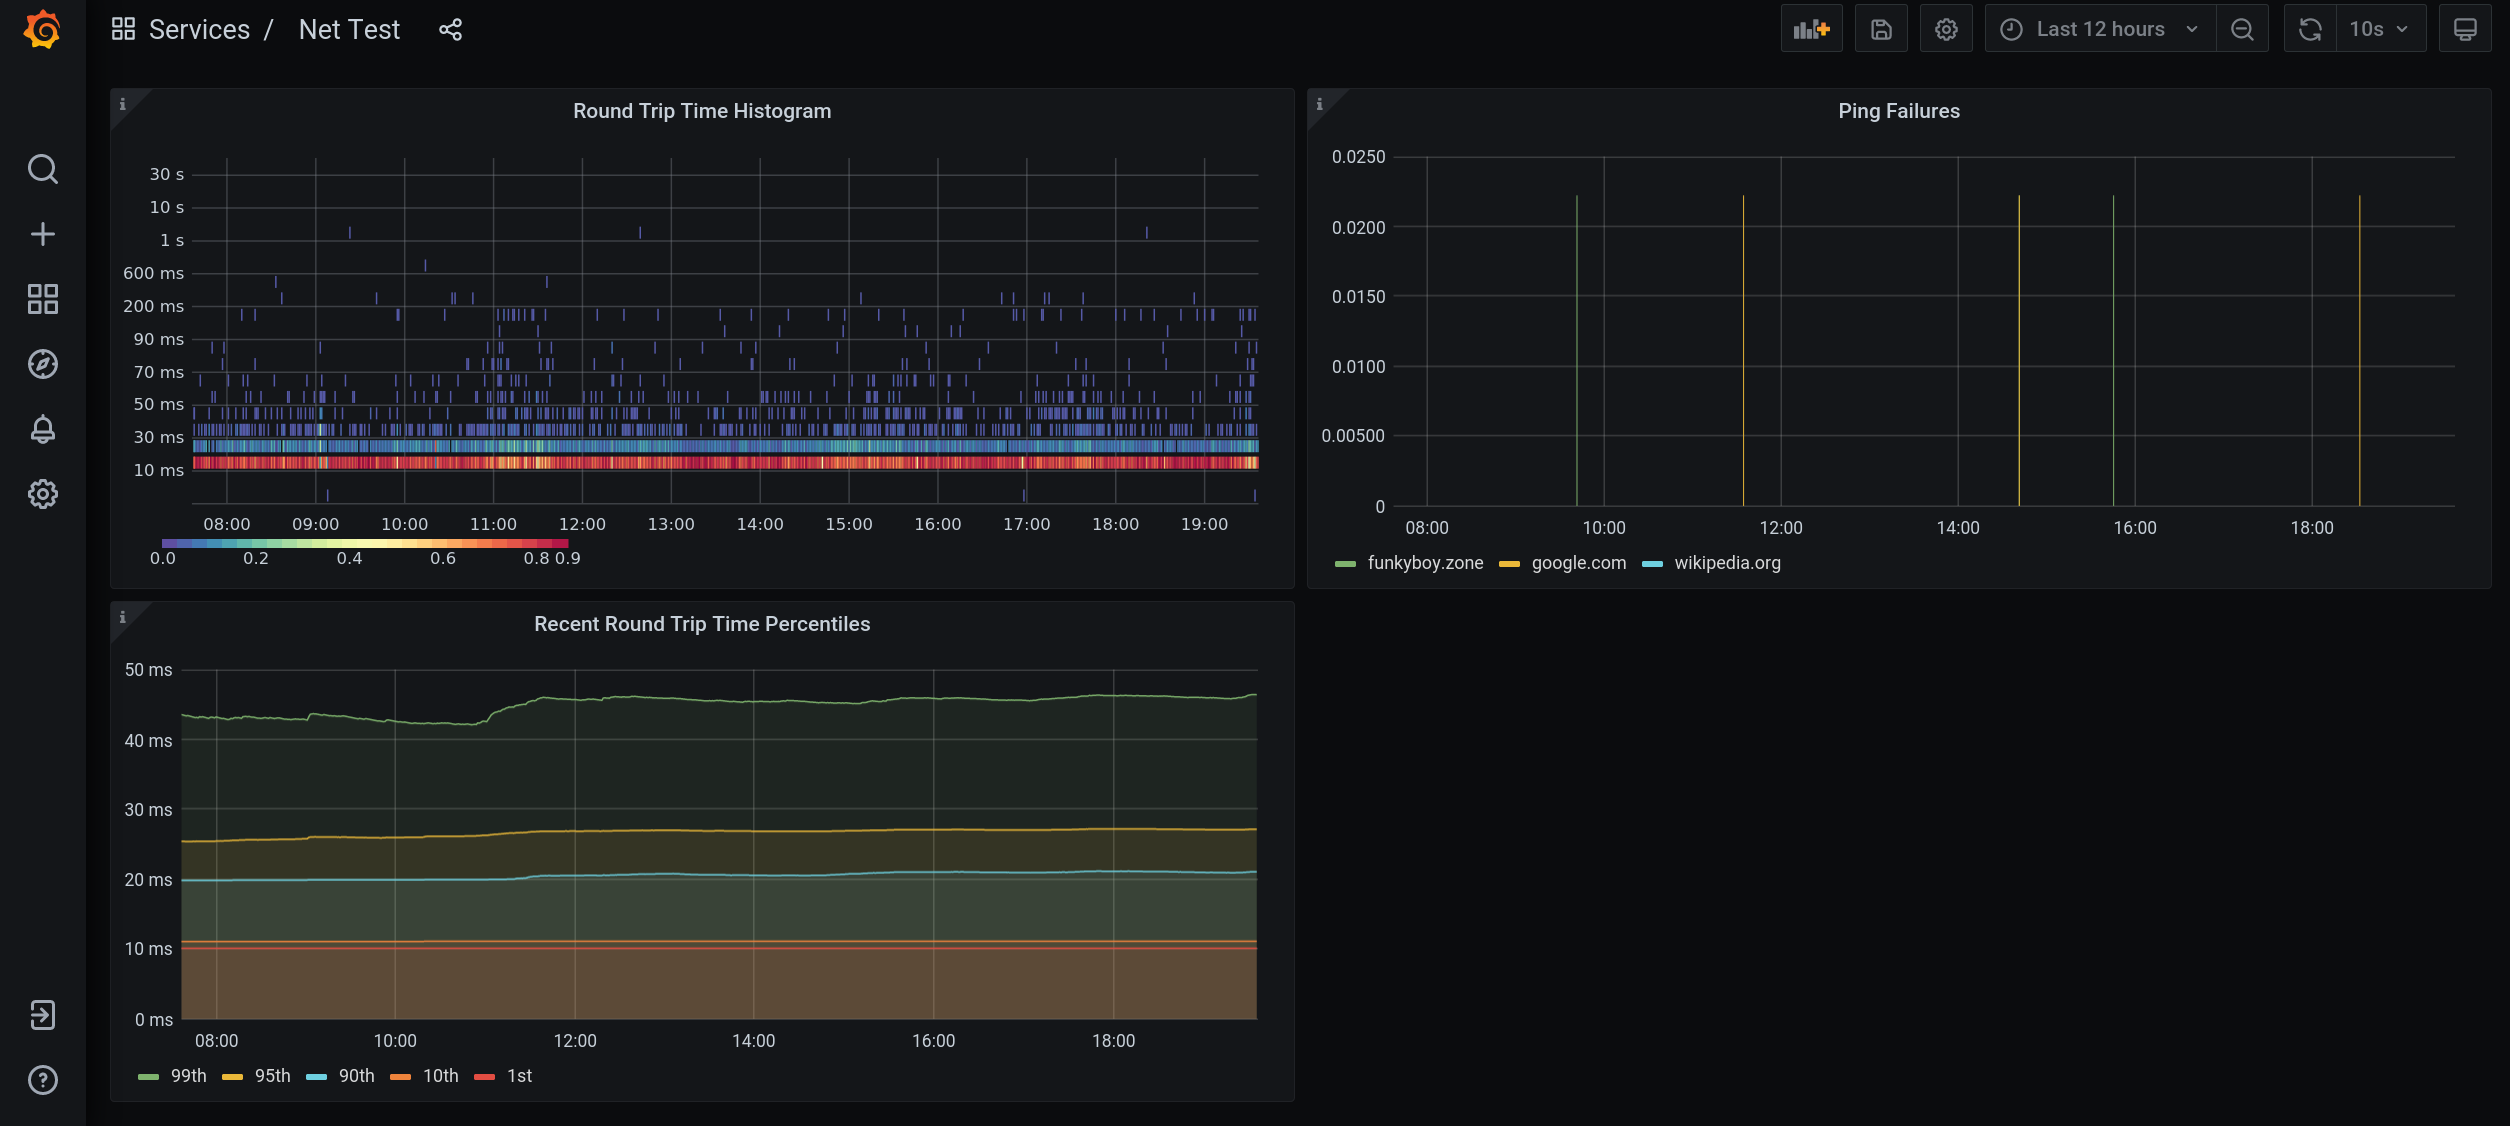
Monitors network connectivity for downtime.
The Net Test program performs measurements and publishes the resulting metrics for Prometheus to scrape.
Prometheus and Grafana Docker containers are provided setup and ready to analyse Net Test data.
The Net Test tool measures results and publishes them for Prometheus. Grafana is used to view the data.
A Docker Compose setup is provided to make this process as easy as running a single command, see Run with Docker Compose.
If one would like to run the setup without Docker Compose see Run Manually.
The behavior of the net-test tool is specified using command line options.
The tool is configured with a list of target hosts, a host picking strategy, and a set of measurements to take.
Target host options:
-t string: Target hosts (DNS or IP4) to measure (can be provided multiple times)-T string: Add this target host to the beginning of existing target hosts
Host picking strategy:
-f: Only measure the first target host and fallover to other following target hosts if the measurement fails (incompatible with -a) (default true)-a: Measure all target hosts (incompatible with -f)
Measurement options:
-p int: Interval in milliseconds at which to perform the ping measurement. A value of -1 disables this test. Results recorded to theping_rtt_msandping_failures_totalmetrics with thetarget_hostlabel. (default 10000)
Other options:
-m string: Host on which to serve Prometheus metrics (default ":2112")
A Docker Compose file is provided which orchestrates the execution of Net Test, Prometheus, and Grafana.
Run:
docker-compose up -d
Then visit 127.0.0.1:3000 and view the Net Test dashboard.
To customize the measurements and behavior of Net Test one must edit the Docker Compose configuration. Make a copy of docker-compose.custom.example.yml named docker-compose.custom.yml. Edit the services.net_test.command field in this file with your custom command line options.
For example this docker-compose.custom.yml file tells Net Test to measure example.com before any other target hosts, and run the ping test every second (see Command Line Options):
version: "3.9"
services:
  net_test:
    command: net-test -T example.com -p 1000
Run your custom Docker Compose setup with the following command:
docker-compose -f docker-compose.yml -f docker-compose.custom.yml up -d
This tells Docker Compose to look at the docker-compose.yml and docker-compose.custom.yml files for configuration. The docker-compose.yml file contains the original Docker Compose setup details. Your docker-compose.custom.yml file contains an override for the container which runs the Net Test tool.
This is a lot to type every time, so the helper script custom-docker-compose is provided to make life easier. The following is equivalent to the command above:
./custom-docker-compose up -d
The Net Test tool is written in Go. Run it:
go run main.go
See Command Line Options for details.
Next run Prometheus and have it scrape the host on which you set Net Test to publish metrics. By default this is 127.0.0.1:2112.
Finally run Grafana, use the configuration files provided in the grafana/ directory.
Measurements are placed in Prometheus. The following measurement types create the following metrics:
Ping (-p <ms interval>)
ping_rtt_ms(Histogram, labelstarget_host): Round trip time to target hostping_failures_total(Count, labelstarget_host): Incremented when a target host cannot be reached
Grafana is hosted at 127.0.0.1:3000 by the provided Docker containers. A dashboard named "Net Test" has been pre-configured to show all available measurement data.
