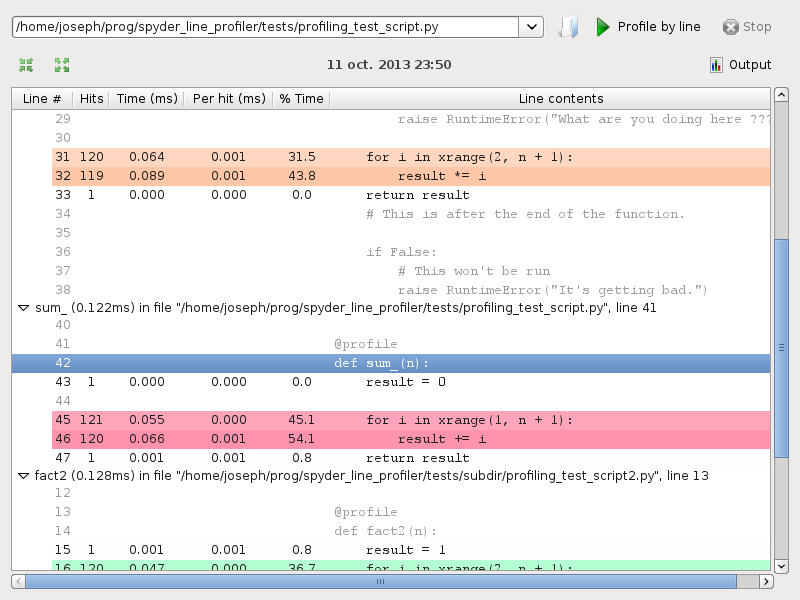
This is a plugin to run the python line profiler and memory_profiler from within the spyder editor.
The code is an adaptation of the profiler plugin integrated in spyder.
Note: This plugin is compatible with spyder version 2.3.X. Here is the version for spyder 3.0.
Put the files p_lineprofiler.py, p_memoryprofiler.py, widgets/lineprofilergui.py, and widgets/memoryprofilergui.py in the directory spyderplugins/ from the spyder installation.
For example on Linux this should be /usr/lib/python2.7/dist-packages/spyderplugins/ or equivalent.
Line profiler requirements: The line_profiler module and the kernprof script have to be installed and accessible on the system. See the official line_profiler website for instructions.
Memory profiler requirements: The memory_profiler module has to be installed. See the official memory_profiler website for instructions.
Add a @profile decorator to the functions that you wish to profile then press Shift+F10 (line profiler default) or Ctrl+Shift+F10 (memory profiler default) to run the profiler on the current script, or go to Run > Profile line by line or Run > Profile memory line by line.
The results will be shown in a dockwidget, grouped by function. Lines with a stronger color take more time to run (line profiler) or have the largest increments in memory usage (memory profiler).
Line profiler:
