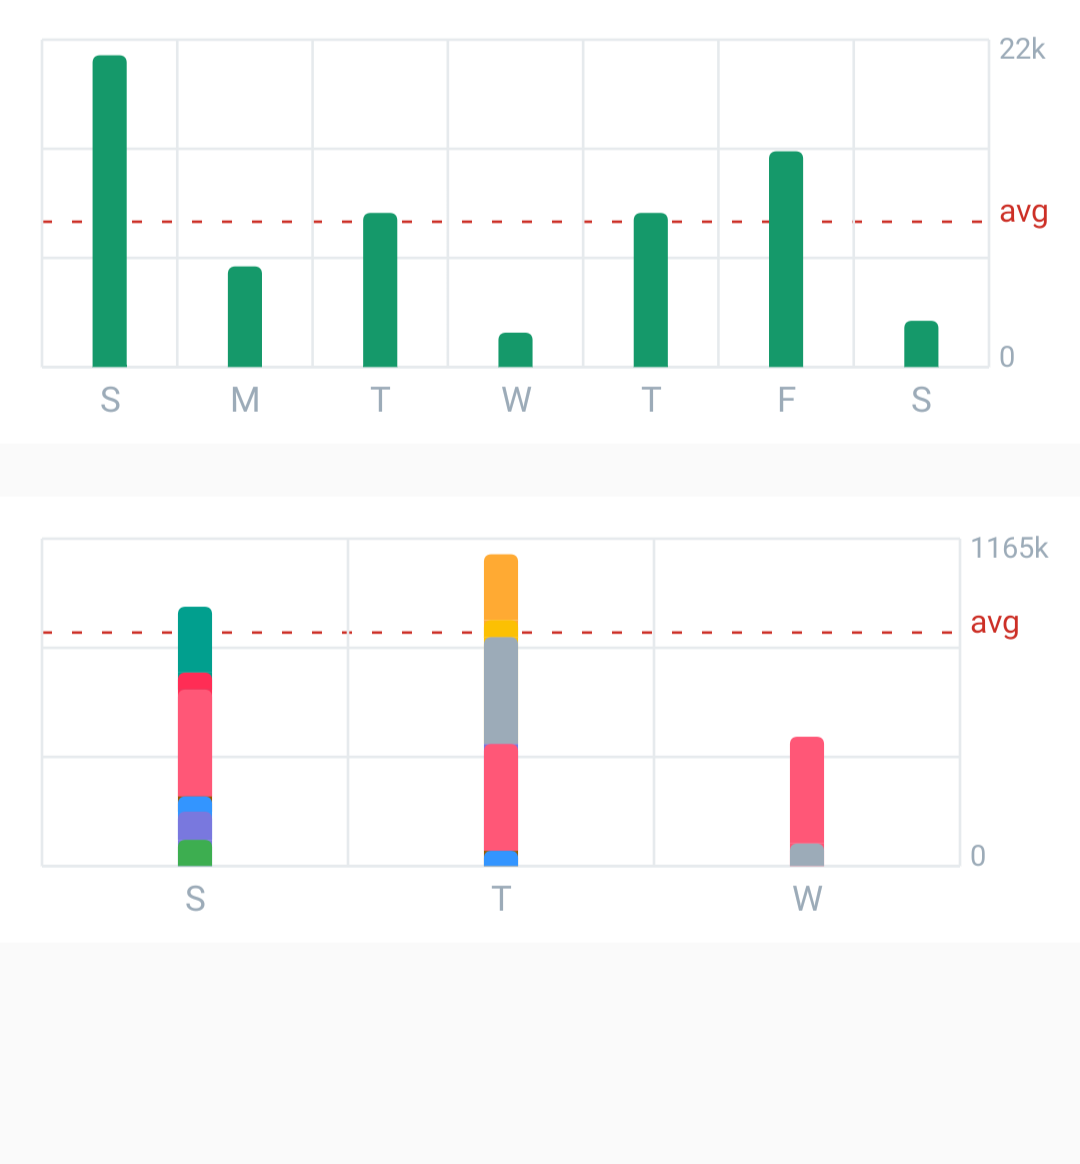
Florent-Charts is a light,flexible and customizable graphing library built with Jetpack Compose.

- Vertical Bar Graph
- Subdivided Bar Graph
repositories {
  mavenCentral()
}

dependencies {
  implementation 'io.github.nouvell:florent-charts:1.0.0'
}To draw a subdivided graph quickly like one in the example below:
Y
▲
│
│
│   ┌─────┐
│   │  A  │
│   ├─────┤
│   │  B  │   ┌─────┐
│   ├─────┤   │     │
│   │     │   │  D  │
│   │  C  │   │     │
└───┴─────┴───┴─────┴──────► X
     Sales    Expenses
Invoke the SubDividedBarGraph function and provide a list of Section.
A Section accepts a label and subsections (a list of portions of the section in question) as params.
And that's it! You've now have a beautiful subdivided graph :)
    SubDividedBarGraph(
        dataPoints = listOf(
            Section(
                label = "Sales",
                subSections = listOf(
                    SubSection(234_343.0, Color(0xFF019F8E)),
                    SubSection(60_500.0, Color(0xFFFF2D55)),
                    SubSection(380_000.0, Color(0xFFFF5777)),
                ),
            ),
            Section(
                label = "Expenses",
                subSections = listOf(
                    SubSection(234_343.0, Color(0xFFFFAA33)),
                ),
            ),
        ),
        modifier = Modifier
            .background(Color.White)
            .fillMaxWidth()
            .height(170.dp),
    )
But wait, there's more! SubDividedBarGraph has more params that allow you to customize the graph.
barThickness allows you to specify how wide you want your bars to be in Dp.
graphLineColor allows you to specify the color of the grid behind the bars.
labelTextColor allows you to specify the color of the text that is used to label the graph.