This repository contains RTOS tracing toolkit based orbuculum (https://orbcode.org/orbuculum/) tools, FreeRTOS (https://www.freertos.org/index.html) and TraceCompass (https://eclipse.dev/tracecompass/).
See README inside each directory for more information.
- ./demo - demo project for generating RTOS traces
- ./tool - Python tool for convering
orbcatoutput into format that can be ingested by TraceCompass - ./tracecompass-plugin - TraceCompass plugin for displaying and analyzing RTOS traces
-
Compile and flash demo project (see ./demo) - for example
busy_blinkerscenario -
Connect Orbtrace and start
orbuculumserver process:shell> orbtrace.exe -T 4 -v 2 Orbtrace version V2.1.0 Got device [Orbcode Orbtrace, S/N *****] Setting port width to 4 OK shell> orbuculum.exe -v 2 -m 1000 -t 1,2 orbuculum version V2.1.0 Report Intv : 1000 mS Use/Strip TPIU : True (Channel List 1,2) Started Network interface for channel 1 on port 3443 Started Network interface for channel 2 on port 3444 84.4 KBits/sec 1: 74% 2: 0% Waste: 26%
-
With orbuculum running in the background, hold target board in reset (by holding reset button)
-
Start
orbdumpand redirect output to fileshell> orbdump -l <record length in milliseconds> -o trace.dat -
Release reset button on target board
-
Wait for
orbdumpto finish capturing data -
trace.datwill contain raw trace data including data from RTOS hooks -
Parse trace data into TraceCompass format
shell> cd tool && hatch run dev:orbrtos_trace --trace-file trace.dat trace.logHatch can be installed using pipx. If above command fails with error saying that it can't find
liborbshared library addorbuculumbuild directory to PATH (for Windows) or LD_LIBRARY_PATH (for Linux) environment variable. Alternatively you can setLIBORB_PATHenvironment variable to point toliborbshared library (full path to file, not containing directory). -
Open TraceCompass and install RTOS analysis plugin (see ./tracecompass-plugin) - you can use artifacts from GitHub actions to not build plugin yourself.
-
Create Trace project and open
trace.logfile. Trace type should be assigned automatically. -
In Project Explorer open
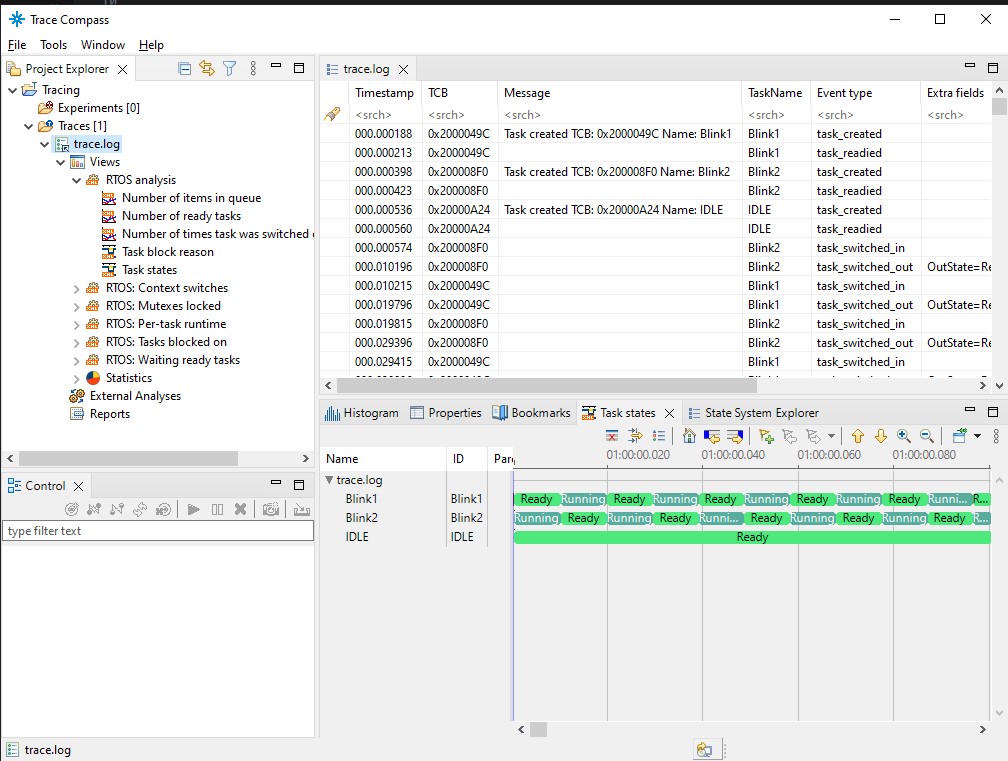
Tracing -> Traces -> trace.log -> View -> RTOS analysis -> Tasks statesview. It should display three tasks (Blink1,Blink2andIDLE) and alternating pattern ofReadyandRunningstates.
TraceCompass plugin provides following analyses and views:
- Tasks state
- Context switching latency
- Time spent by task in
Readystate - How many tasks are
Readyover time - How long each task was running
- Mutex locking - by which task and how long
- Why task was blocked (Work in progress)
- Queue occupancy
Trace is generated by providing FreeRTOS hooks that emits ITM messages. These messages are captured using orbcat in raw format which is then parsed into TraceCompass format using Python script. TraceCompass plugin provides analysis and views for this format.
Note: Local ITM timestamps are required and used to timestamp incoming RTOS trace packets.
It's not straighforward right now (sorry for that). Work to separate hooks into easily portable library is underway. For now you can use files in demo/libs/rtos_trace as base for integrating hooks into your own application. Reports of sucesses and problems are greatly appreciated. Keep in mind that to make trace work you need to get ITM output and DWT cycle counter working on your target board first.
With captured trace in raw format, you can use both Python script in tool folder and TraceCompass to analyze what's going on in your application.