Bivariate maps with ggplot2 and sf
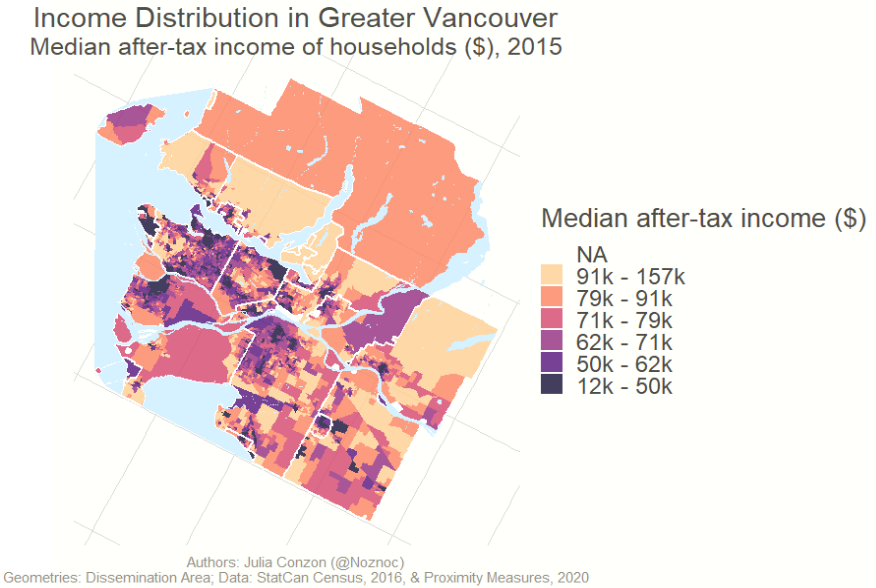
Scripts and tutorial are modified from Timo Grossenbacher and Angelo Zehr. Their original GitHub has the source code they worked on to develop these beautiful maps for a news article in Switzerland. They also have a blog. Their work has been modified for a Canadian context. For this tutorial, you will learn how to make static maps with ggplot2 and sf, using the following data: (1) Statistics Canada Census 2016 Dissemination Area boundaries; (2) income statistics from Census 2016; (3) Centre for Special Business Project's Proximity Measures; (4) BC Digital Elevation Models (DEM). Details on these data sources are provided later.
License concerning the code and the maps produced: CC-BY-SA.

