The project is focusing on exploration of smartphone reviews data from Ukrainian eCommerce marketplace Rozetka.ua and building model to predict sentiment of reviews.
After inspecting the web-site https://rozetka.com.ua/ I noticed that not all reviews have rating. If percentage of such reviews without rating is significant - it may be useful to build a prediction model to fill in missing ratings which will allow to see more complete picture of overall sentiment of Ukrainian consumers toward specific product categories, brands, products within specific price range, etc. Also, it can be useful information for marketplace to get more complete statistics on customers satisfaction with products/services.
The goal of this project is to check the feasibility of the idea and if it's possible to build a model to predict a sentiment of the reviews with the high enough accuracy. Here we will focus on reviews of Smartphones product category. It's also possible to apply the same approach to other product categories, but it's advisable to train separate models for different categories so a model can learn specifics in reviews of particular product category.
Rozetka.ua is a Ukrainian online store and marketplace that was founded in 2005. As of August 2020, the site ranks 7th among the most visited in Ukraine. Initially, the store sold household appliances and electronics, but today you can find there many more categories of products - from clothing to food. A total of 3.9 million products are presented on the site. It is visited daily by 2.5 million people. Such success was achieved through the involvement of third-party sellers - they generate 25% of sales at Rozetka.
Being one of the biggest marketplaces in Ukraine, Rozetka.ua also became a site with the biggest amount of reviews from Ukrainian consumers on wide range of products. This combined with fast and seamless service is allowing Rozetka to retain leading positions in Ukrainian eCommerce retail market.
The first step is to retrieve Smartphones reviews data.
The search for possibility to export reviews from web-site or to use exciting browser extension/plugin didn't bring results, so it was decided to collect the data using web-scraping (scrappy module in python).
The script which retrieves necessary data and writes it into the smartphone_reviews_{current_date}.csv file is located in separate Jupiter notebook Scraping_reviews.ipynb.
Note: the developed web-scraping script does not retrieve all available reviews. It is caused by the fact that web-pages are generated dynamically with "Show more" button. To solve this problem, it's necessary to use tools like Selenium, which can interact with web-pages to get full data previously to parsing html. Here we will proceed with the data generated with the scrapy module functionality as it should be enough for purposes of this project.
Script related to this section is located in separate jupiter notebook Predicting_reviews_sentiment_with_Bert_model.ipynb.
In this section following steps are performed:
- read datasets from the
./reviews_datafolder, - fix data format and parsing issues,
- perform check for duplicates,
- check content of review_text column to drop rows with not enough information,
- create column full_text which contains all text related to the reviews,
- handle missing values.
In this section we explore:
review_ratingvariable,
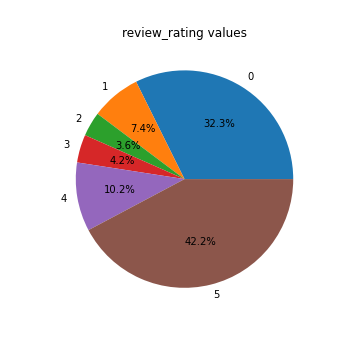
Below is the plot with
review_ratingsvalues. We can see that a big proportion, about 32%, of reviews, don't have filled rating (0 value). So predicting sentiment for reviews without rating can be useful as it will allow to add classification for significant part of the data. Another thing that we can conclude from the plot is that rating distribution is imbalanced - there are much more positive reviews (values 4 and 5) than negative.
product_priceVSreview_ratingcorrelation,review_dateVSreview_datecorrelation,- distribution of
review_textby language in which they are written, - TOP10 Unigrams, Bigrams, Trigrams of
review_textvariable, - meta features analysis of
review_textvariable, - meta features analysis of
product_advatagesvariable, - meta features analysis of
product_disadvantagesvariable.
In this section we do necessary preparation of data for modeling:
- drop rows without ratings and without review text,
- prepare target variable
review_sentimentin the required format, - perform train/test split,
- perform preprocessing with Bert mode.
After preprocessing is done - we build BERT model, explore best learning rate with Learning Rate Finder, set weight decay and train the model on training data.
In this section we:
- check accuracy and confusion matrix on training set,
- Accuracy - 90%.
- Predictions for positive reviews are much more accurate: 94% of all predicted reviews are actually positive and 93% of all positive reviews were detected correctly.
- Predictions for negative reviews are less accurate: only 78% of all predicted reviews are actually negative and 79% of all negative reviews were detected correctly.
- check 5 top losses of the model on training set,
- make predictions and check accuracy and confusion matrix on testing set.
- Accuracy - 87%.
- Area Under the Receiver Operating Characteristic Curve on test dataset is 0.79, so there is a 79.3% chance that the model will be able to distinguish between positive and negative class for reviews.
- Predictions for positive reviews are quite accurate: almost 94% of all predicted reviews are actually positive and 89% of all positive reviews were detected correctly.
- Predictions for negative reviews are less accurate: only 64% of all predicted reviews are actually negative and 77% of all negative reviews were detected correctly.
- We can see from the results that model is biased for predicting positive class as proportion of positive reviews in the training data was much bigger (77% for positive reviews).
In this section we:
- predict sentiment for reviews without rating,
- manual check of predicted sentiments for reviews: accuracy of 40 manually checked records is 62.5% (93% of errors are false positive).
Oversample negative class in the initial data to remove class imbalance in target variable and train BERT model version 2.
In this section we check performance of BERT model v2 :
- check accuracy and confusion matrix on training set,
- Accuracy - 97%.
- Predictions for positive reviews are: 91% of all predicted reviews are actually positive and 99% of all positive reviews were detected correctly.
- Predictions for negative reviews are: 100% of all predicted reviews are actually negative and 97% of all negative reviews were detected correctly.
- make predictions and check accuracy and confusion matrix on testing set,
- Accuracy - 98%.
- Area Under the Receiver Operating Characteristic Curve on test dataset is 0.97, so there is a 97.7% chance that the model will be able to distinguish between positive and negative class for reviews.
- Predictions for positive reviews are: almost 97% of all predicted reviews are actually positive and 94% of all positive reviews were detected correctly.
- Predictions for negative reviews are: 98% of all predicted reviews are actually negative and 99% of all negative reviews were detected correctly.
-
predict sentiment for reviews without rating,
-
manual check of predicted sentiments for reviews: accuracy of 40 manually checked records is 75% (100% of errors are false positive),
-
plot distribution of reviews by sentiment (positive/negative) for:
- only data with filled review_rating: sentiment was calculated from review_rating values
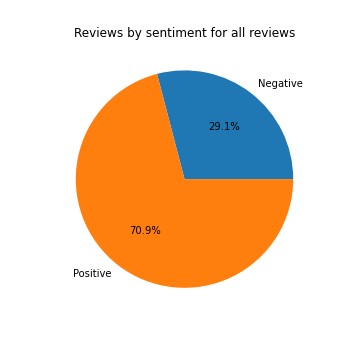
- all data: sentiment was calculated from review_rating or predicted by model
From the plots above we can see that the model predicts bigger fraction of negative sentiment reviews among records without filled rating in comparison to reviews with rating. If we compare data with only filled rating and all data (with predicted sentiment), we can see that fraction of positive sentiment reviews drops by 5.9% (from 76.8% to 70.9%).
In this project we retrieved and explored reviews data from the web-site Rozetka.ua. We were able to build a model to predict reviews sentiment that performed quite well on the training set and showed good results on the unseen data: it predicted correct sentiment for 98% of reviews in testing set.
However, after predicting sentiment for the reviews without rating and inspecting 40 predictions - we can see that accuracy seems to be much less for them, about 75%. Content of reviews are often confusing, model doesn't always identify sentiment correctly and sometimes it's hard to identify it even with manual check.
Model predicts that 41% of the reviews without rating contain negative sentiment and 59% contain positive sentiment. While among reviews with filled rating - there are only 23% of reviews with negative sentiment (almost twice less). By adding sentiment classified by the model to the table with sentiment calculated from the rating set by customers, we can see that fraction of negative class in overall data increased from 23% to 29%.
- Explore differences between rated and unrated reviews. Seems like unrated reviews have different characteristics and distribution (possibly they contain more complains about product defects/warranty issues than rated reviews).
- Load more reviews data.
- Increase number of epochs during model training.
- As on the unrated data all errors are false positive, it can be useful to try to oversample reviews with negative sentiment, so negative class proportion is even bigger than for positive class. It can help model to learn more about negative class.
- Clean the data to remove questions/statements and feedback about shop.
It is important to consider that reviews records sometimes don't contain actual review of the product, but rather feedback about shop/service or questions. It may be useful to explore how to classify reviews into categories: product review, service feedback, question (record can have category product review and service feedback at the same time).
This way it will be possible to refine statistics about sentiment regarding products. Also, it may be useful to analyze what sentiment customers express about marketplace itself and service received. The next step could be classifying feedback about service in the categories: with what customers are satisfied and what they complain about.


