Installation | Configuration | Resources Displayed | Contributing
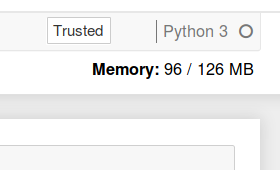
Jupyter Resource Usage is an extension for Jupyter Notebooks and JupyterLab that displays an indication of how much resources your current notebook server and its children (kernels, terminals, etc) are using. This is displayed in the main toolbar in the notebook itself, refreshing every 5s.
You can currently install this package from PyPI.
pip install jupyter-resource-usageOr with conda:
conda install -c conda-forge jupyter-resource-usageIf your notebook version is < 5.3, you need to enable the extension manually.
jupyter serverextension enable --py jupyter-resource-usage --sys-prefix
jupyter nbextension install --py jupyter-resource-usage --sys-prefix
jupyter nbextension enable --py jupyter-resource-usage --sys-prefix
jupyter-resource-usage can display a memory limit (but not enforce it). You can set this
in several ways:
MEM_LIMITenvironment variable. This is set by JupyterHub if using a spawner that supports it.- In the commandline when starting
jupyter notebook, as--ResourceUseDisplay.mem_limit. - In your Jupyter notebook traitlets config file
The limit needs to be set as an integer in Bytes.
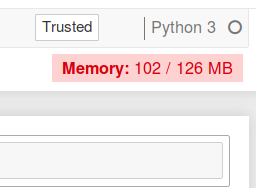
The background of the resource display can be changed to red when the user is near a memory limit. The threshold for this warning can be configured as a fraction of the memory limit.
If you want to flash the warning to the user when they are within 10% of the memory limit, you
can set the parameter --ResourceUseDisplay.mem_warning_threshold=0.1.
jupyter-resource-usage can also track CPU usage and report a cpu_percent value as part of the /api/metrics/v1 response.
You can set the cpu_limit in several ways:
CPU_LIMITenvironment variable. This is set by JupyterHub if using a spawner that supports it.- In the command line when starting
jupyter notebook, as--ResourceUseDisplay.cpu_limit. - In your Jupyter notebook traitlets config file
The limit corresponds to the number of cpus the user has access to, but does not enforce it.
Additionally, you can set the track_cpu_percent trait to enable CPU usage tracking (disabled by default):
c = get_config()
c.ResourceUseDisplay.track_cpu_percent = True
As a command line argument:
jupyter notebook --ResourceUseDisplay.track_cpu_percent=TrueThere is a known bug with Prometheus metrics which causes "lag"/pauses in the UI. To workaround this you can disable Prometheus metric reporting using:
--ResourceUseDisplay.enable_prometheus_metrics=False
Currently the server extension only reports memory usage (just RSS) and CPU usage. Other metrics will be added in the future as needed.
The notebook extension currently doesn't show CPU usage, only memory usage.
If you would like to contribute to the project, please read the CONTRIBUTING.md. The CONTRIBUTING.md file
explains how to set up a development installation and how to run the test suite.


