#greenspace ###Bayes Hackathon 2016 repo for Department of Interior #Interior #DOI
We heard from the DOI and parks officials that they wanted to answer the question "Why are people not visiting parks?"
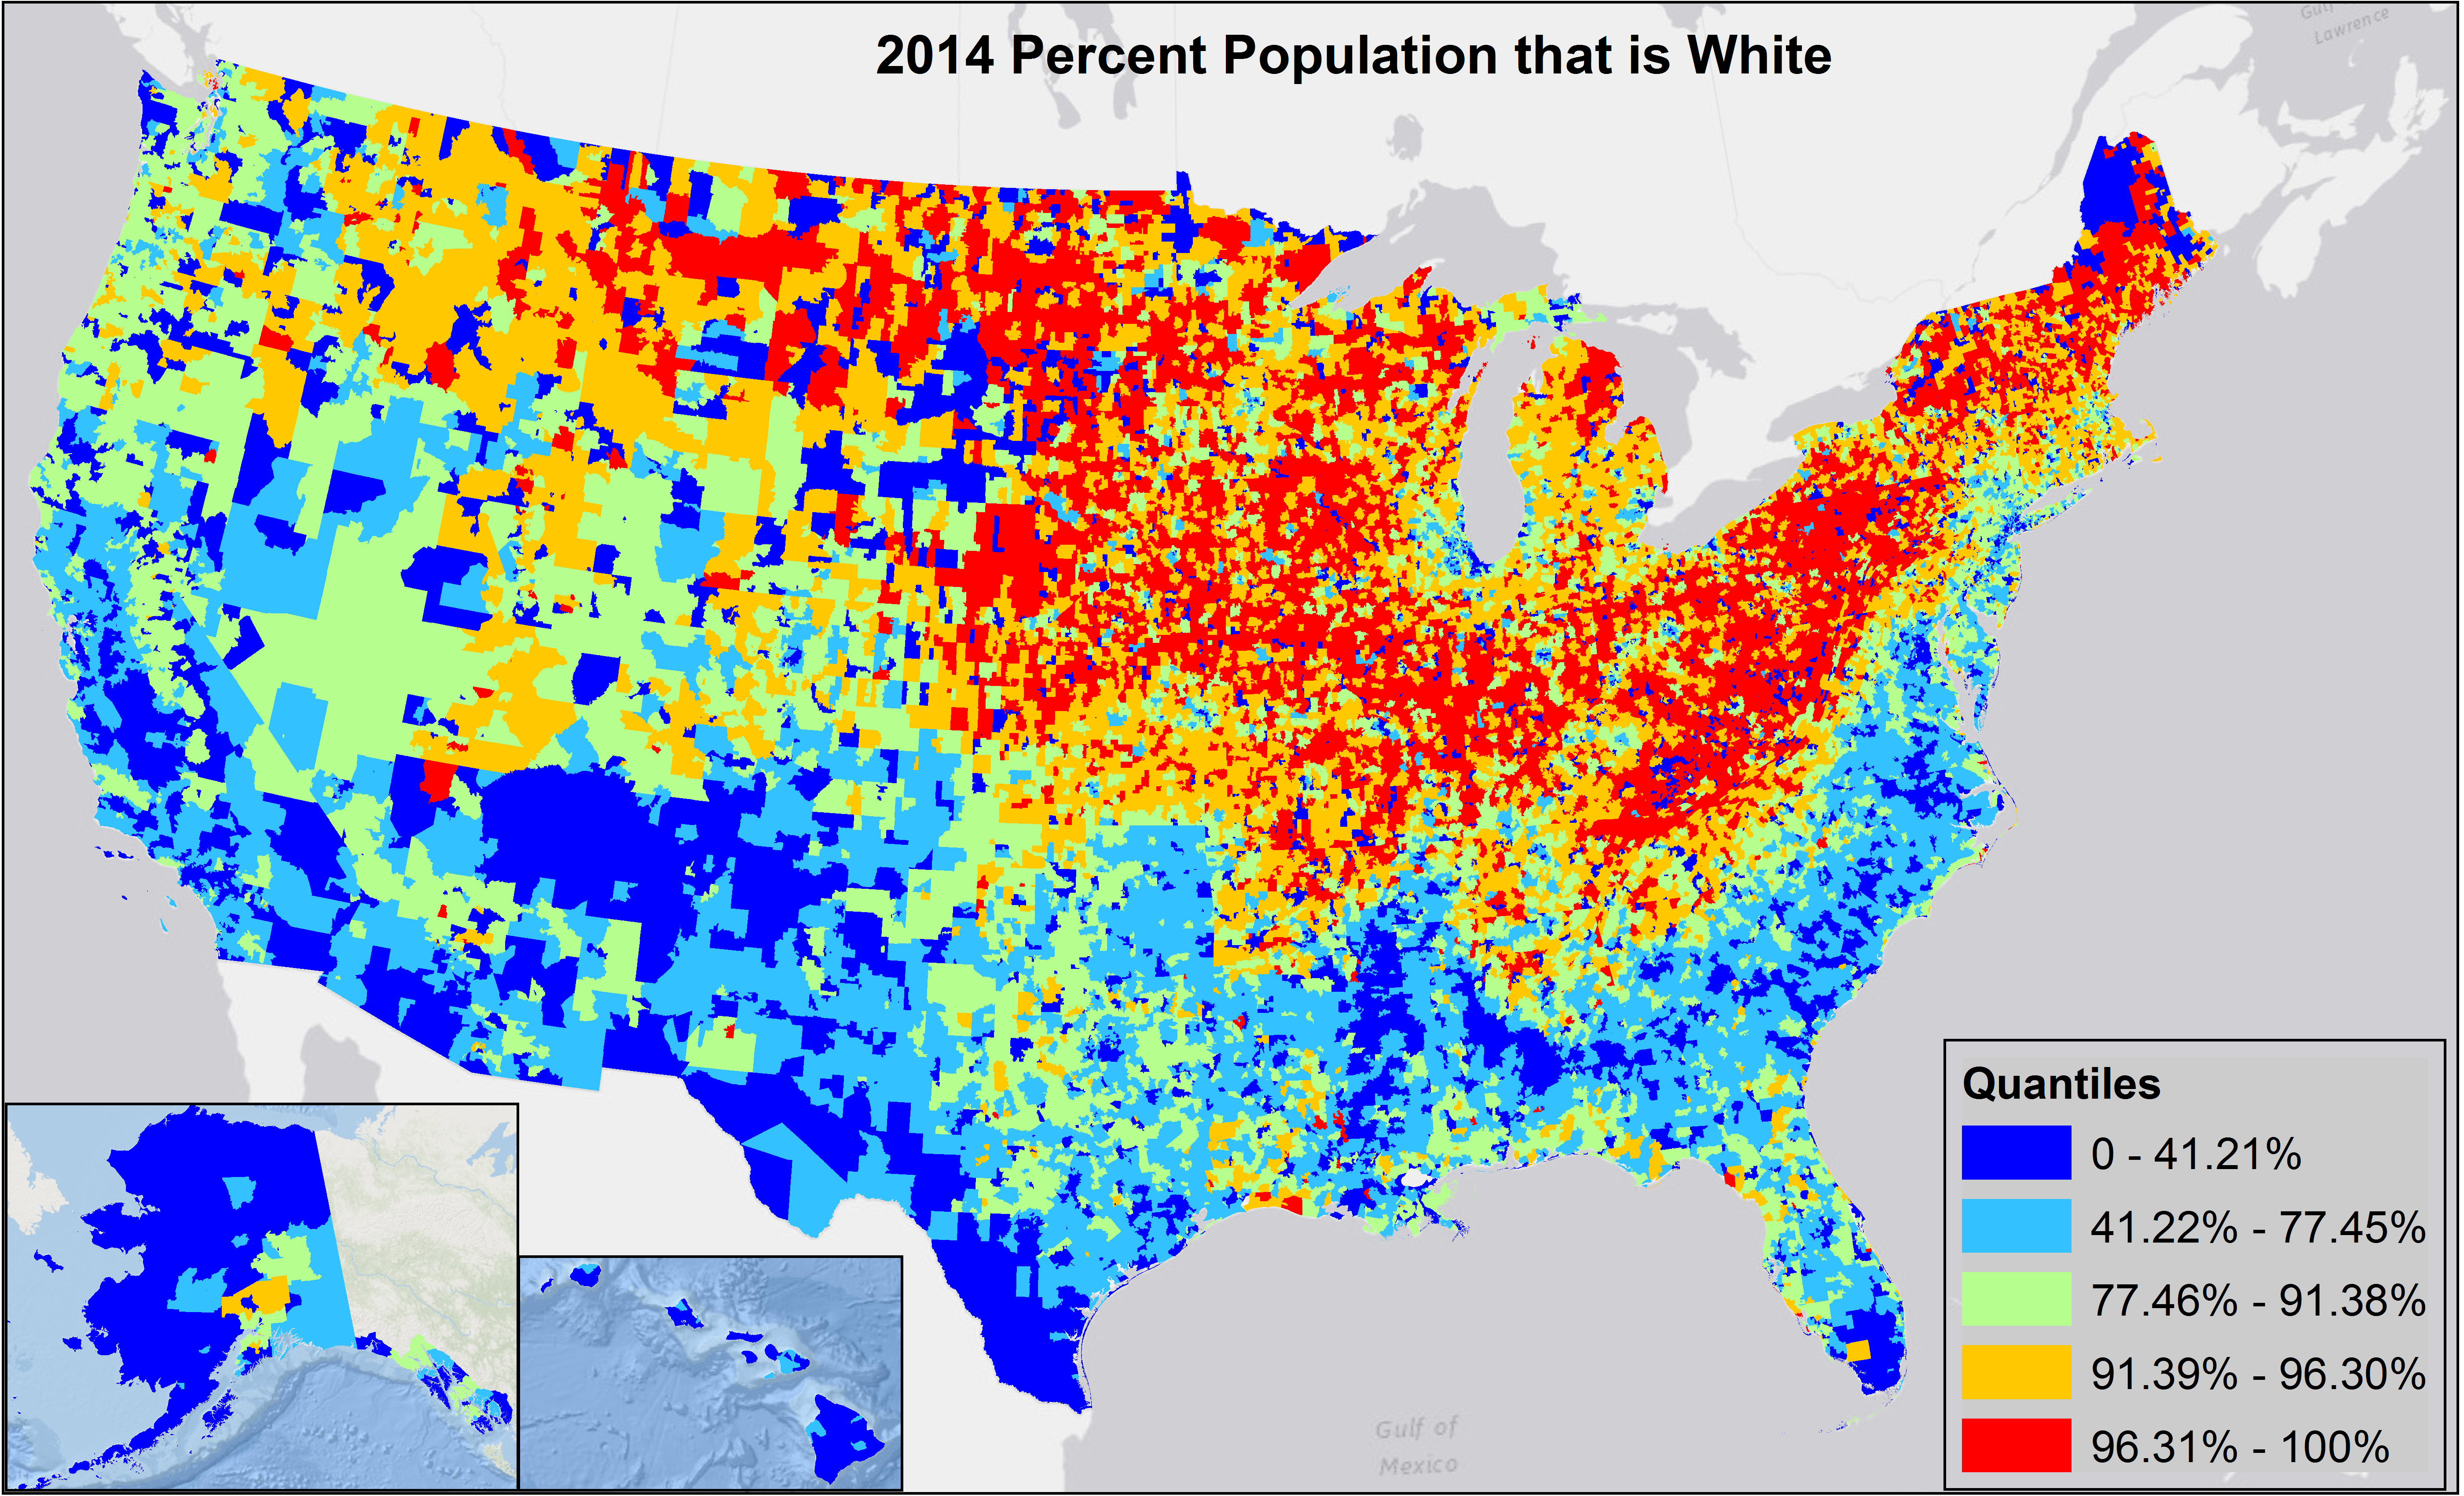
To answer this question we looked for correlations in park visit data and demographic information organized by zip code. We performed a SciKit learn decision tree, Pandas multivariate linear regression (least squares method using stats model module), and made static map visualizations in ArcGIS (thanks to Stacy Supak!).
We have been aggregating data of national park visits with demographic data.
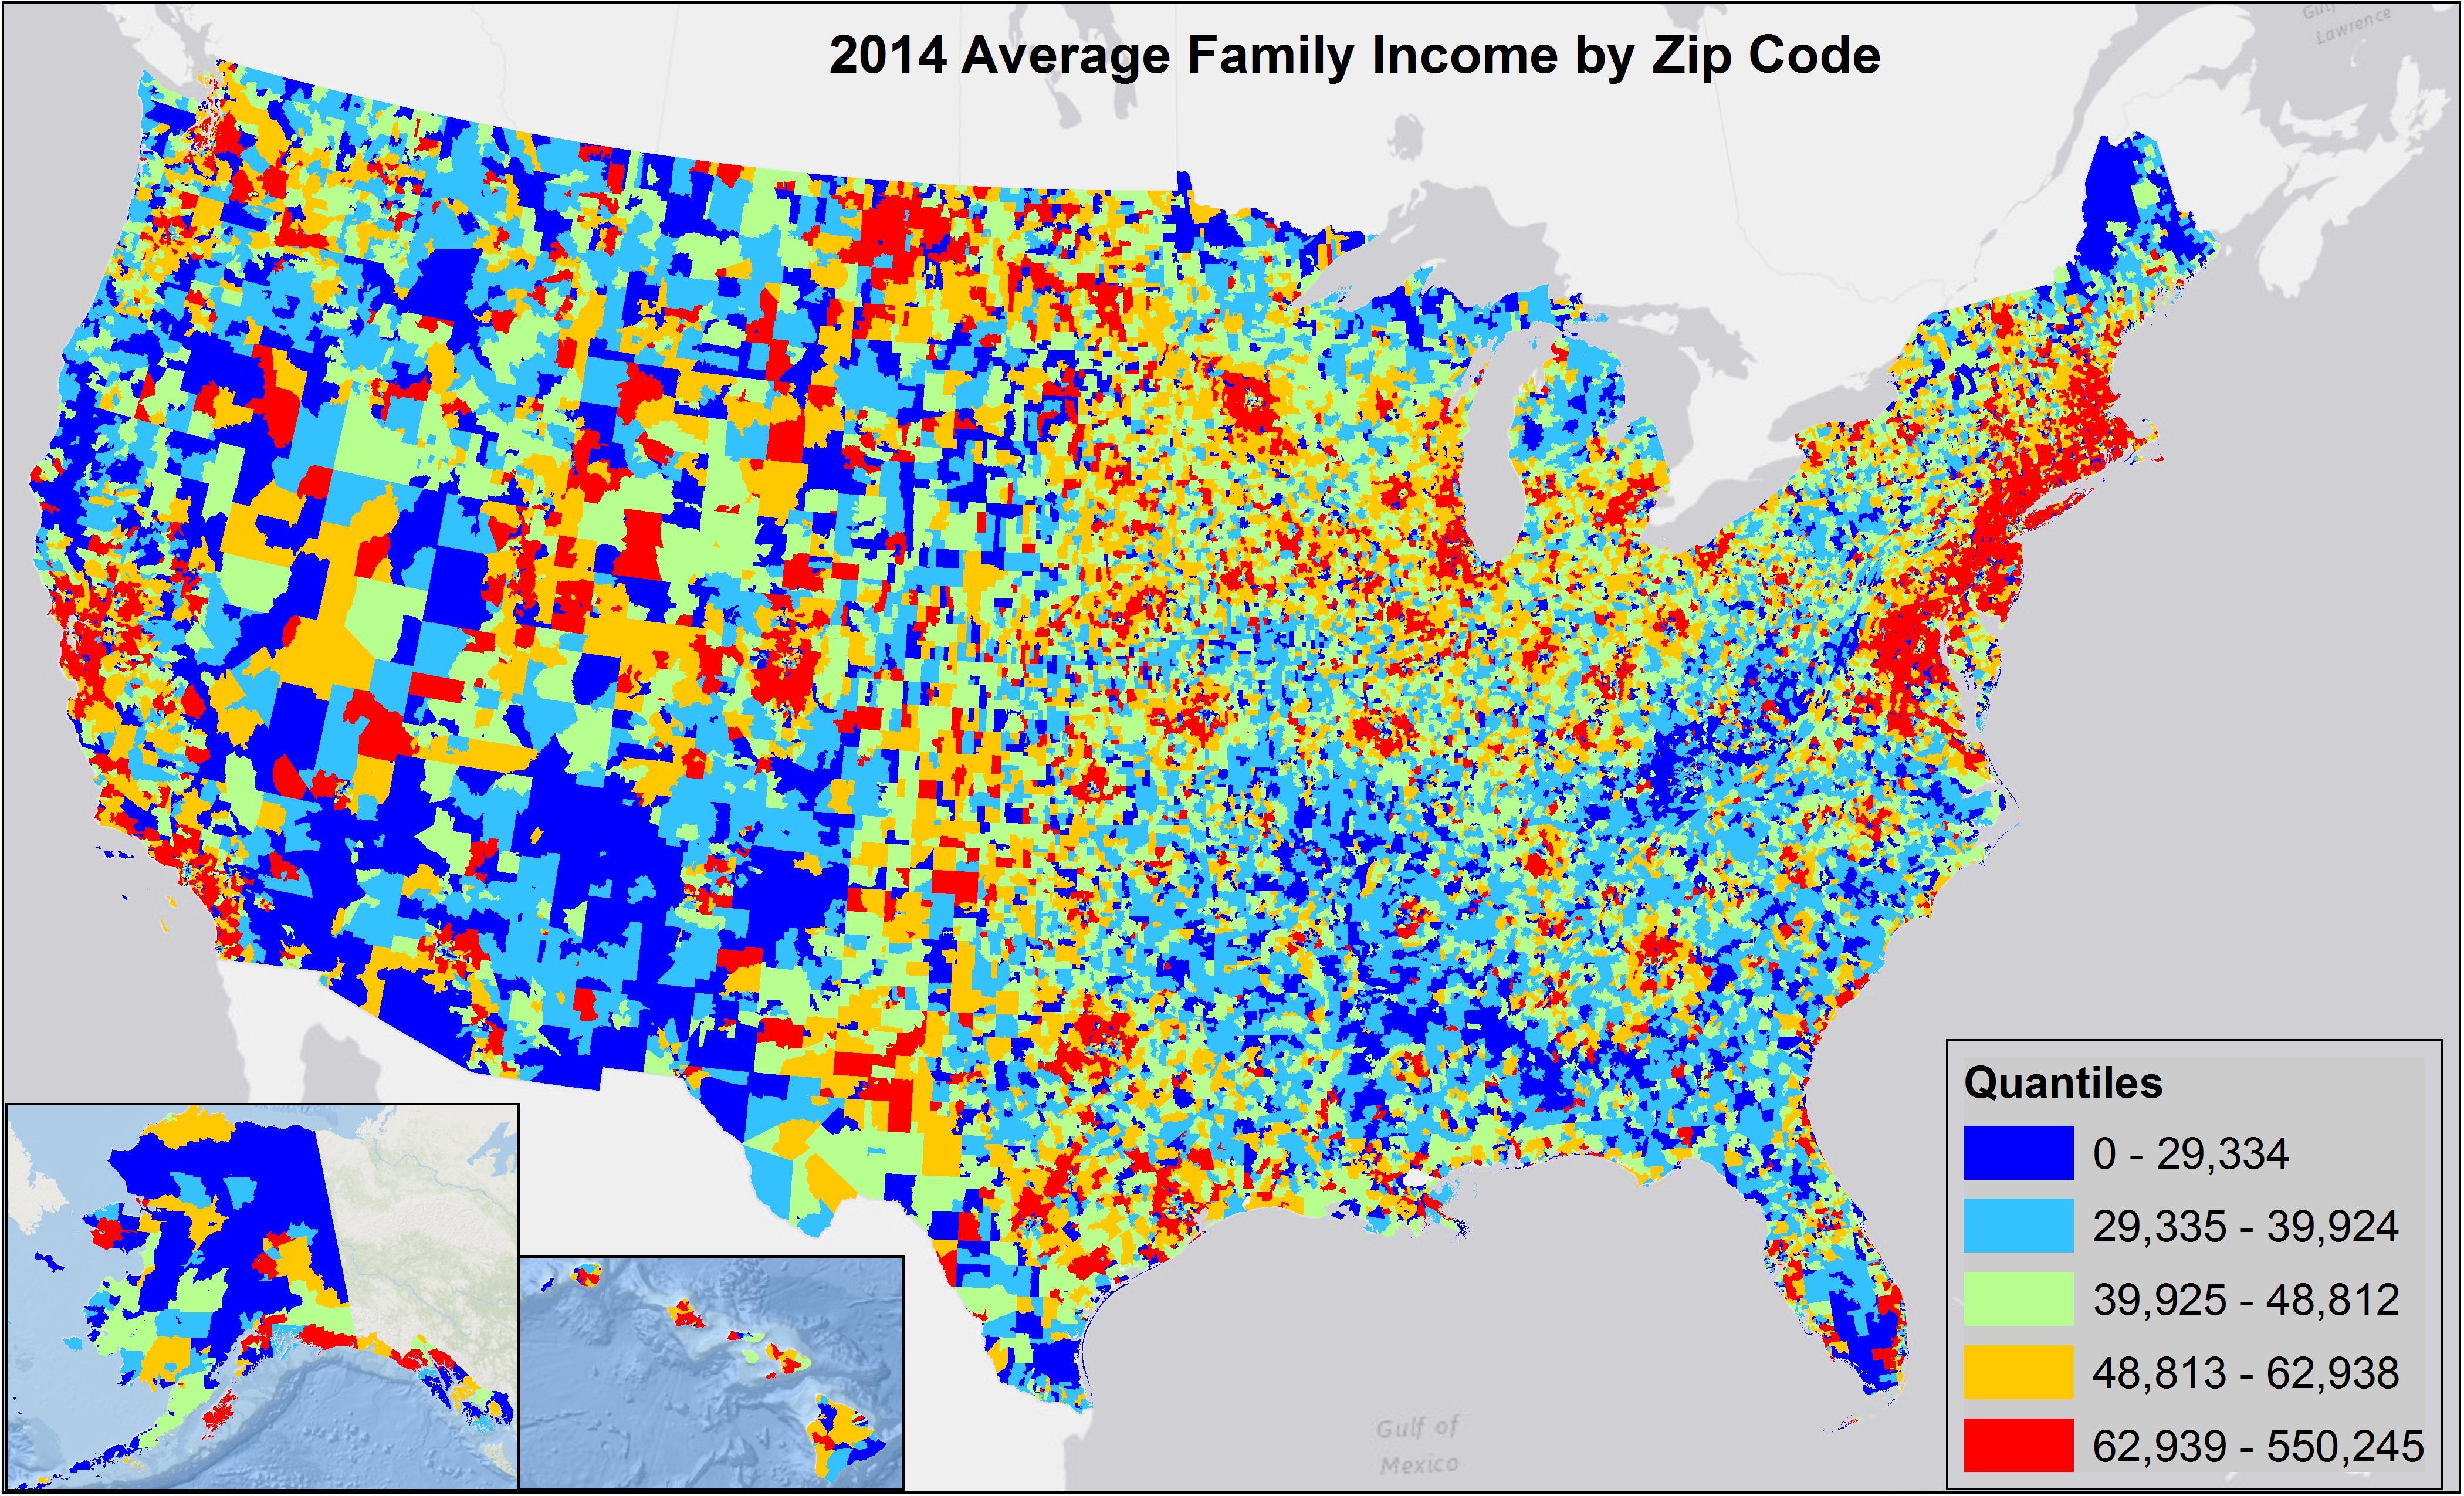
- Aggregate Annual Family Income (B19127_001E)
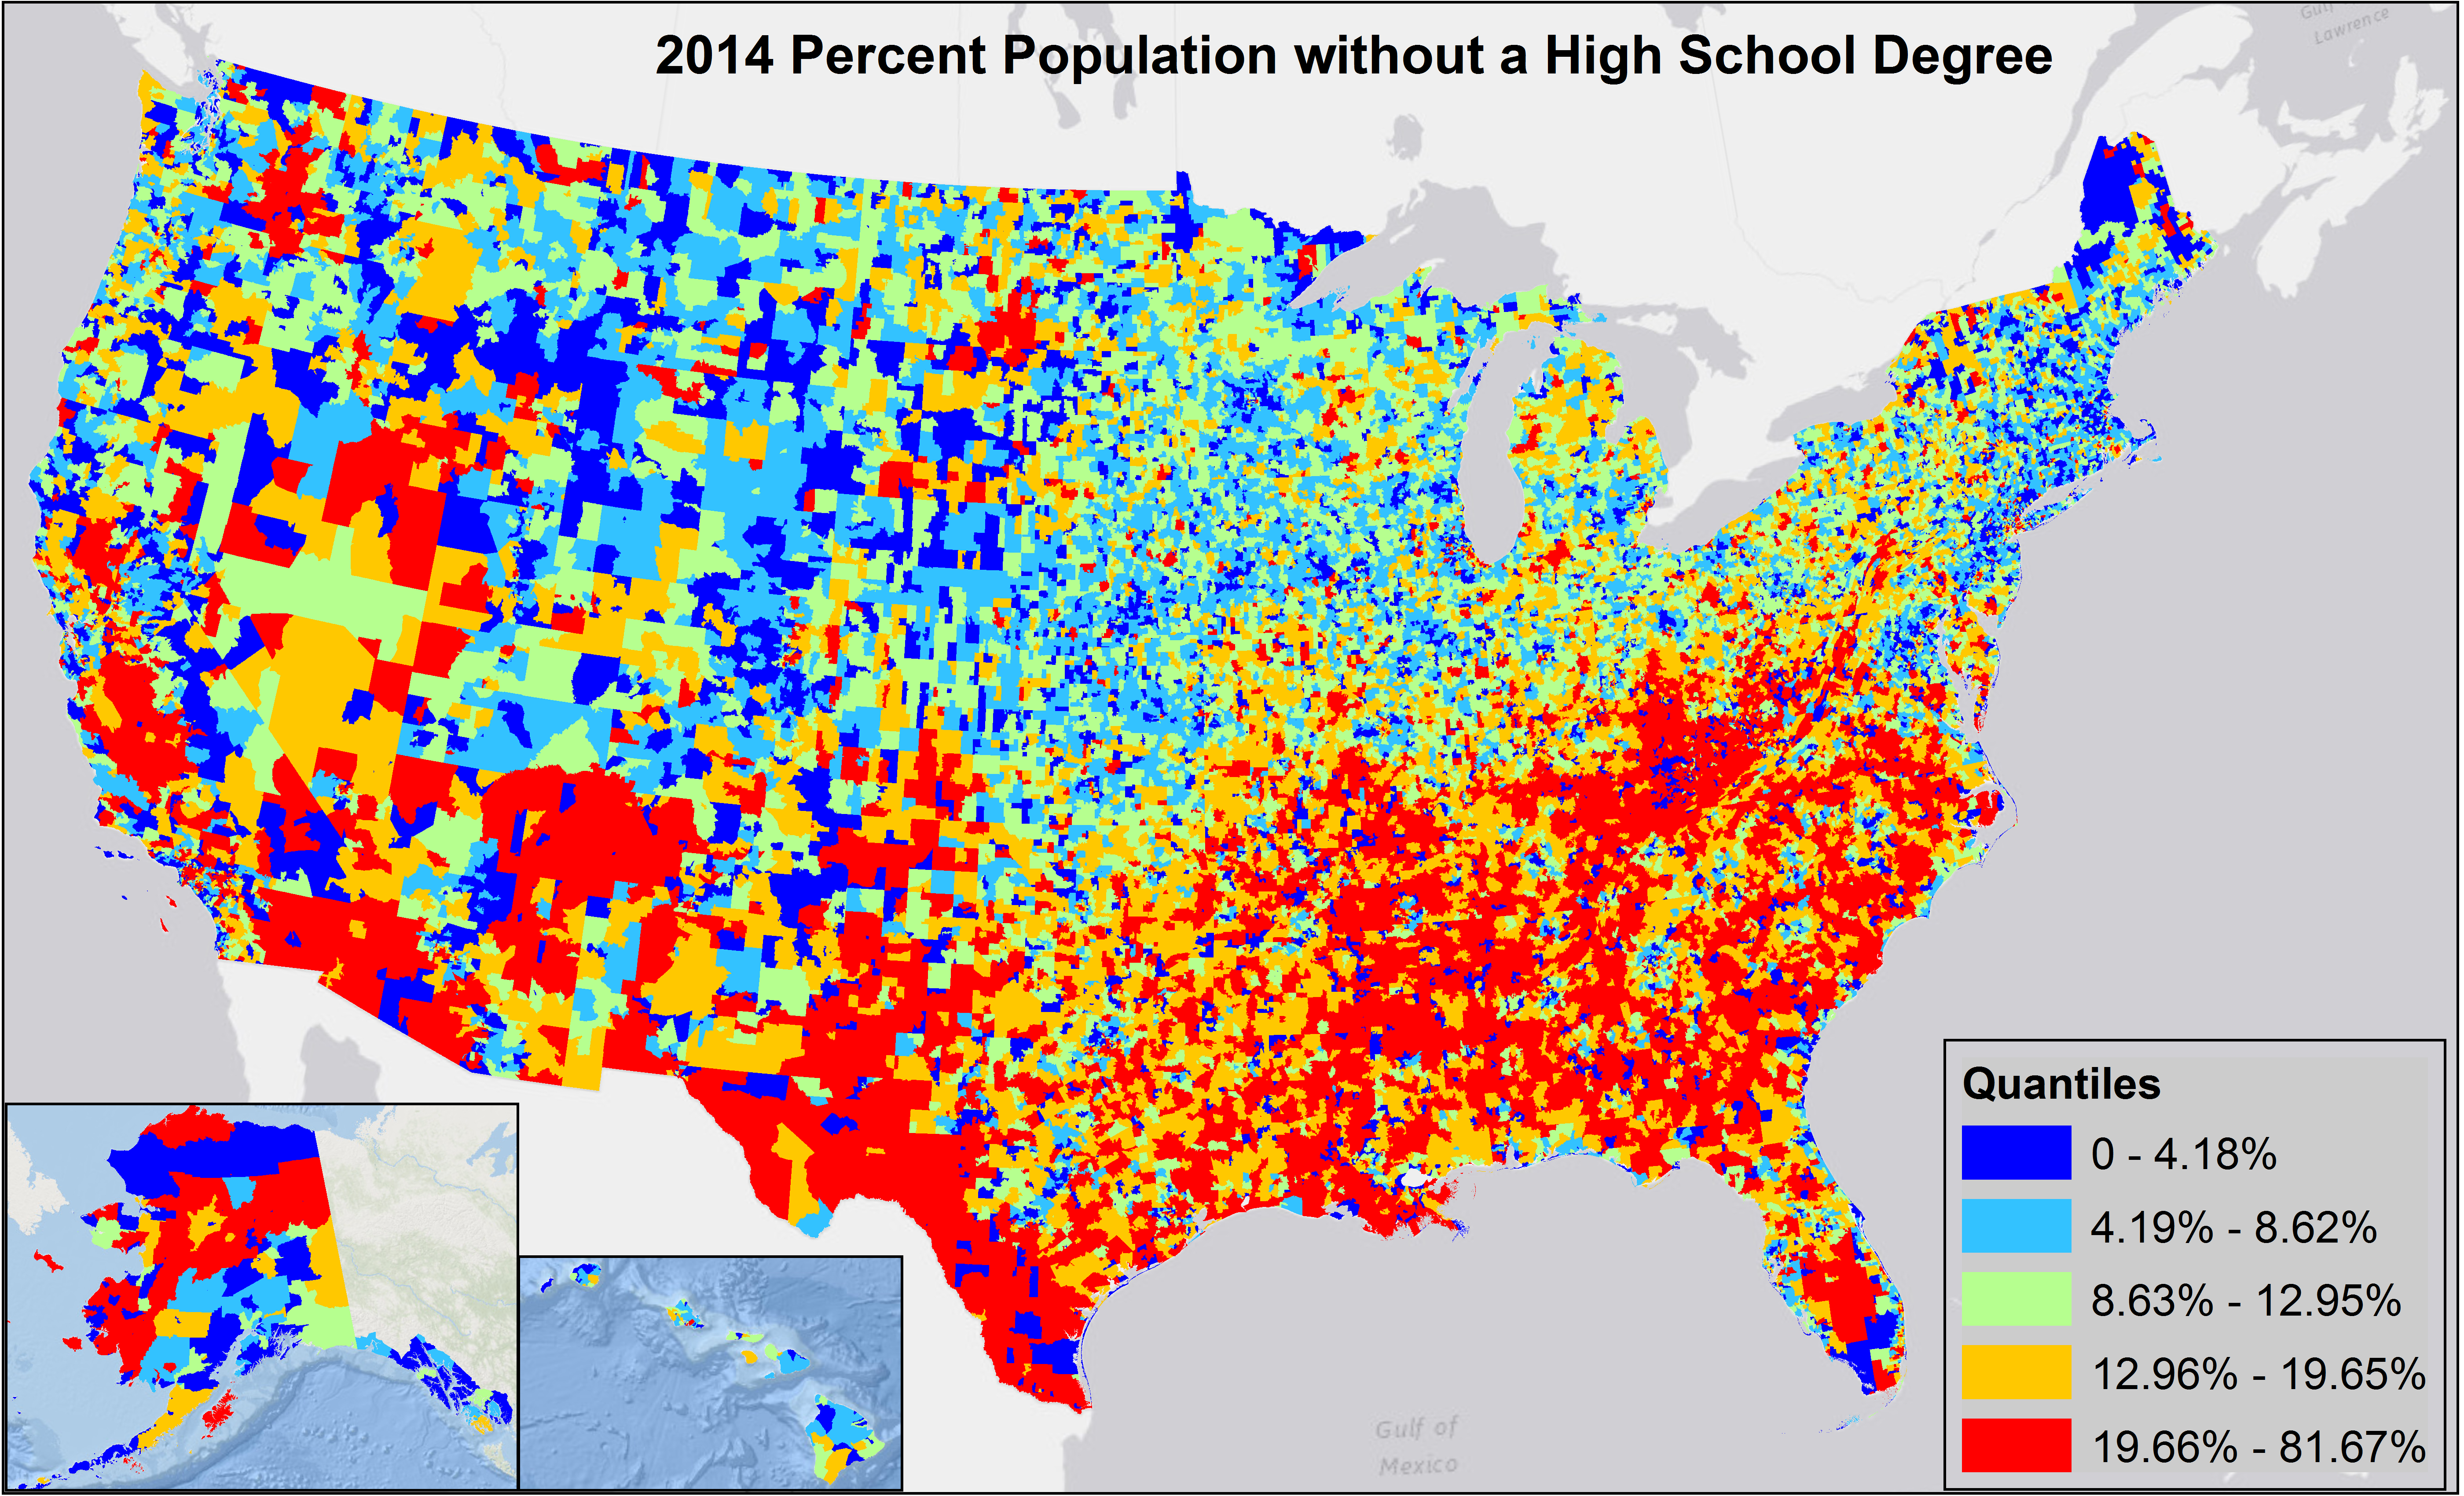
- Education Level (B06009_001E, B06009_002E, B06009_003E, B06009_004E, B06009_005E, B06009_006E)
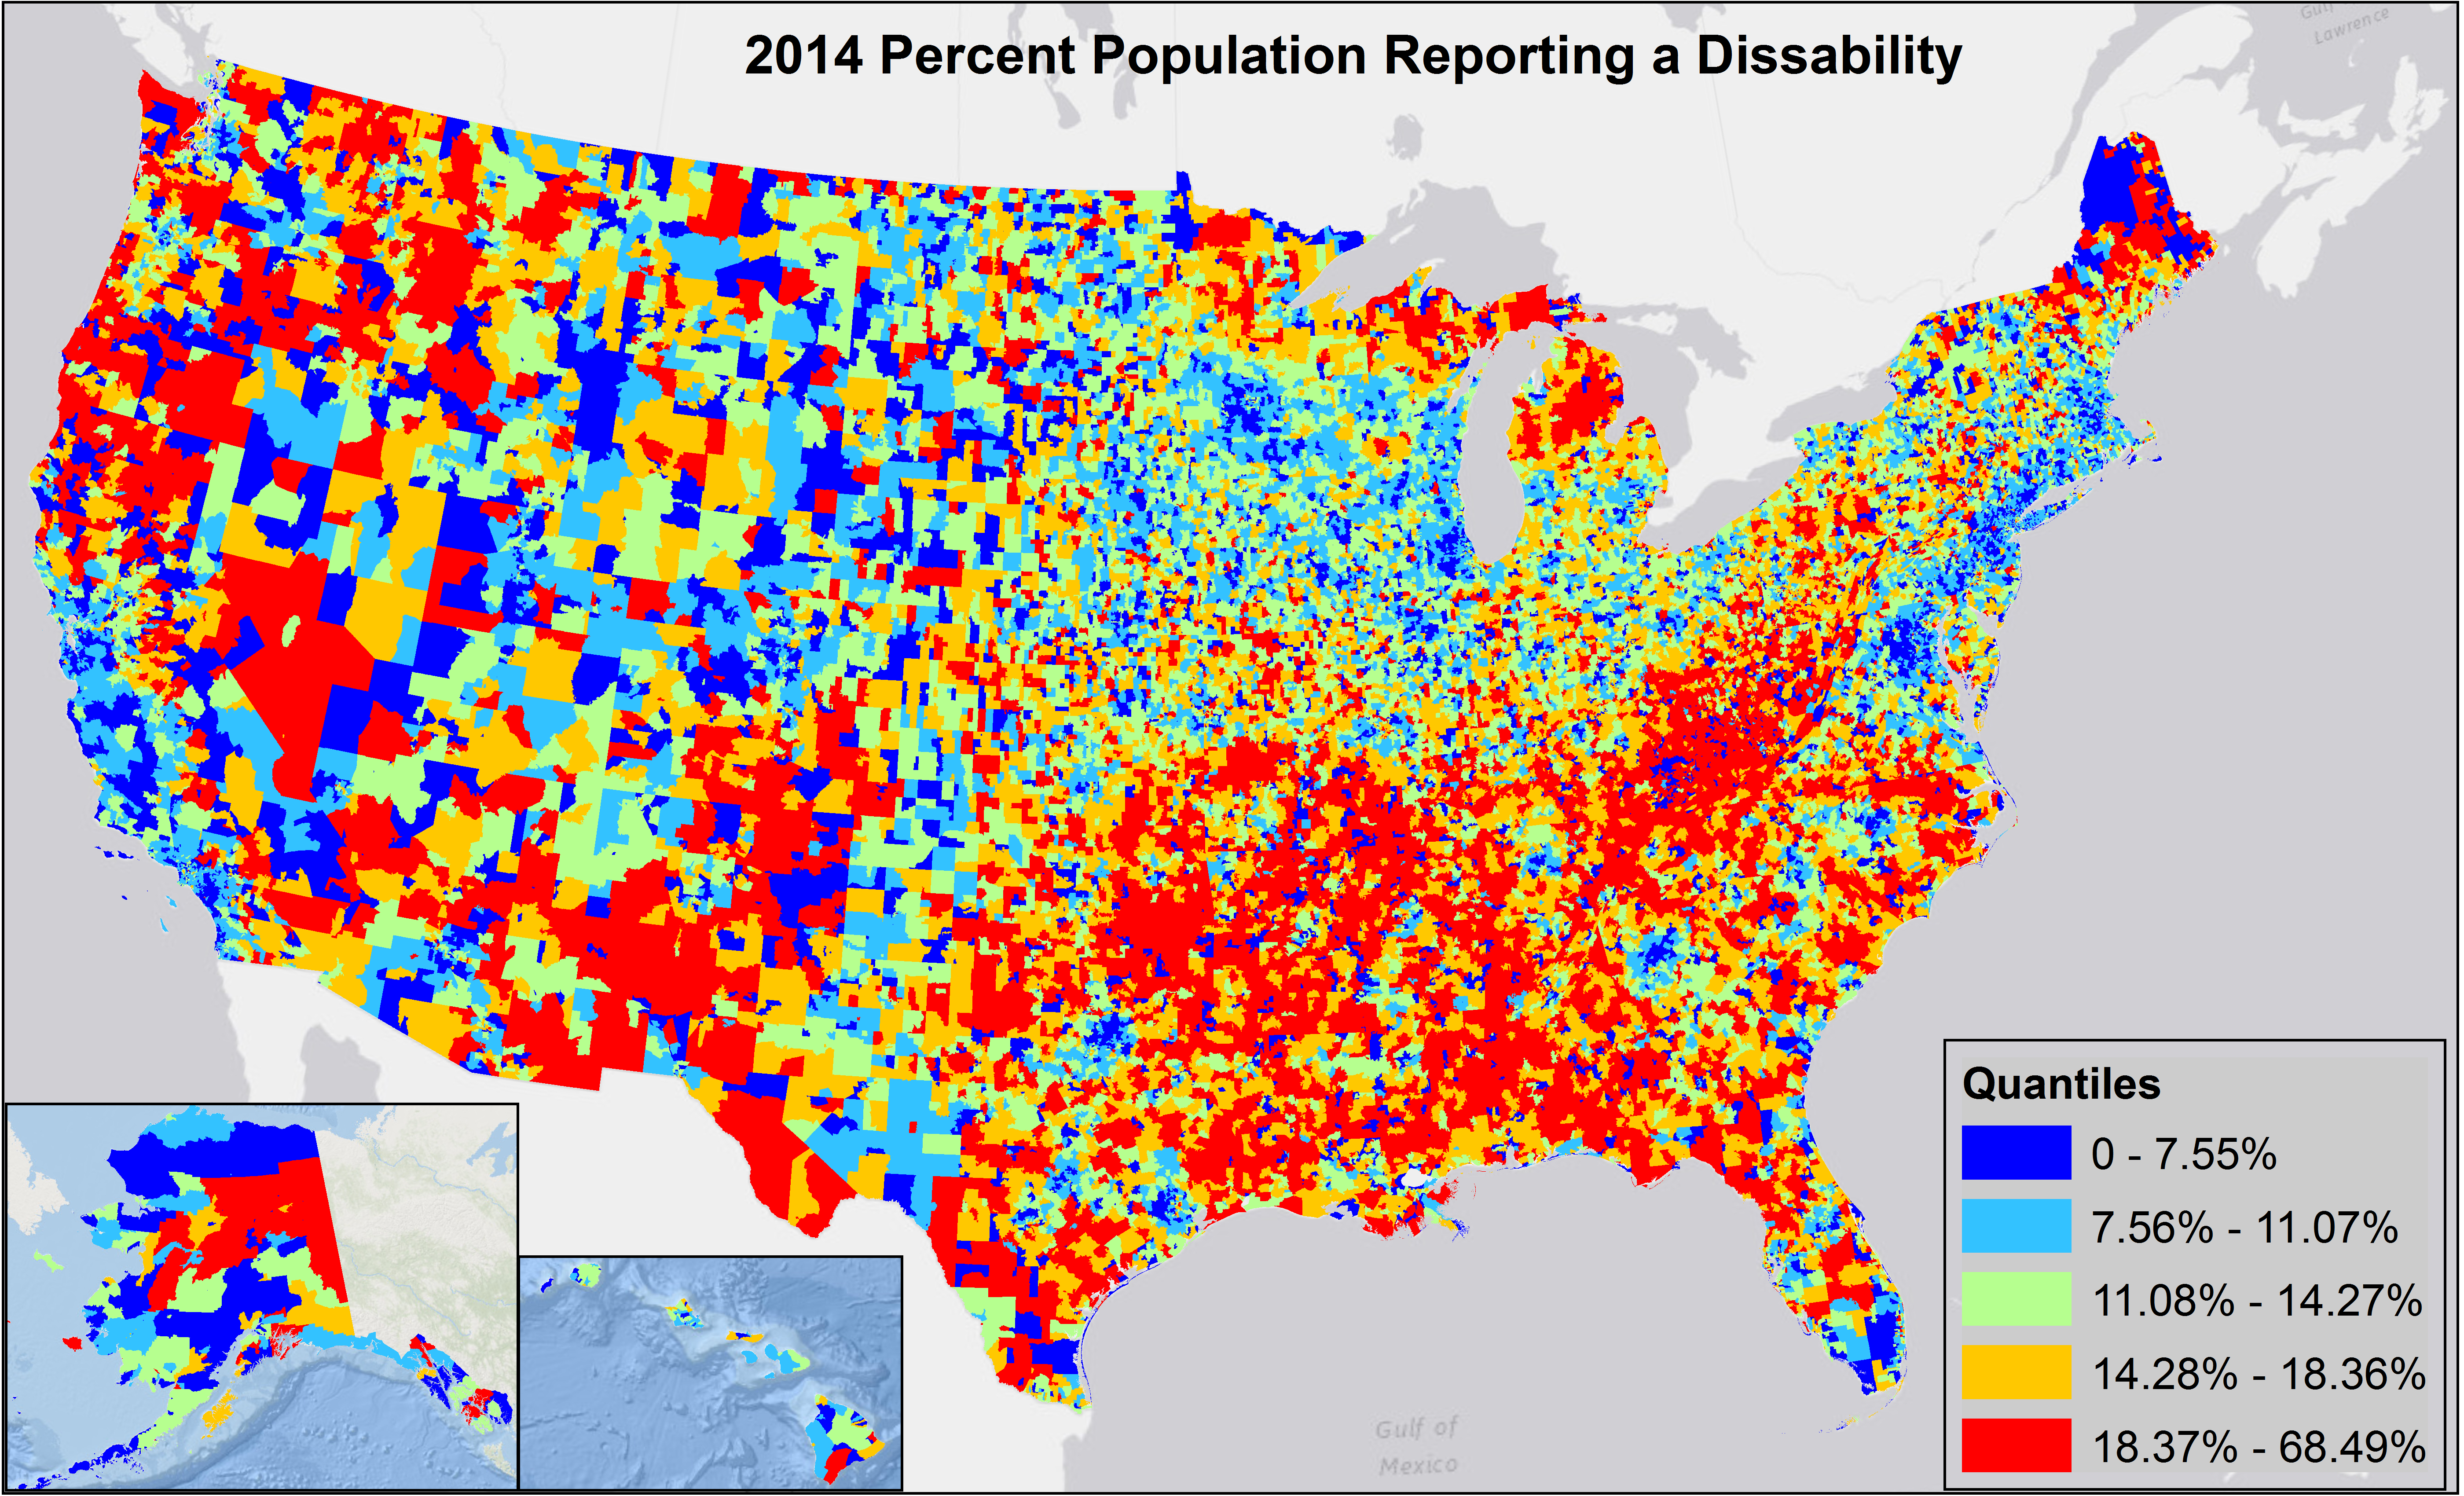
- Disability Percentage ('B18101_001E','B18101_002E','B18101_003E','B18101_004E','B18101_006E','B18101_007E','B18101_009E','B18101_010E','B18101_012E','B18101_013E','B18101_015E','B18101_016E','B18101_018E','B18101_019E','B18101_021E','B18101_022E','B18101_023E','B18101_025E','B18101_026E','B18101_028E','B18101_029E','B18101_031E','B18101_032E','B18101_034E','B18101_035E','B18101_037E','B18101_038E')
- Race
- Median Age
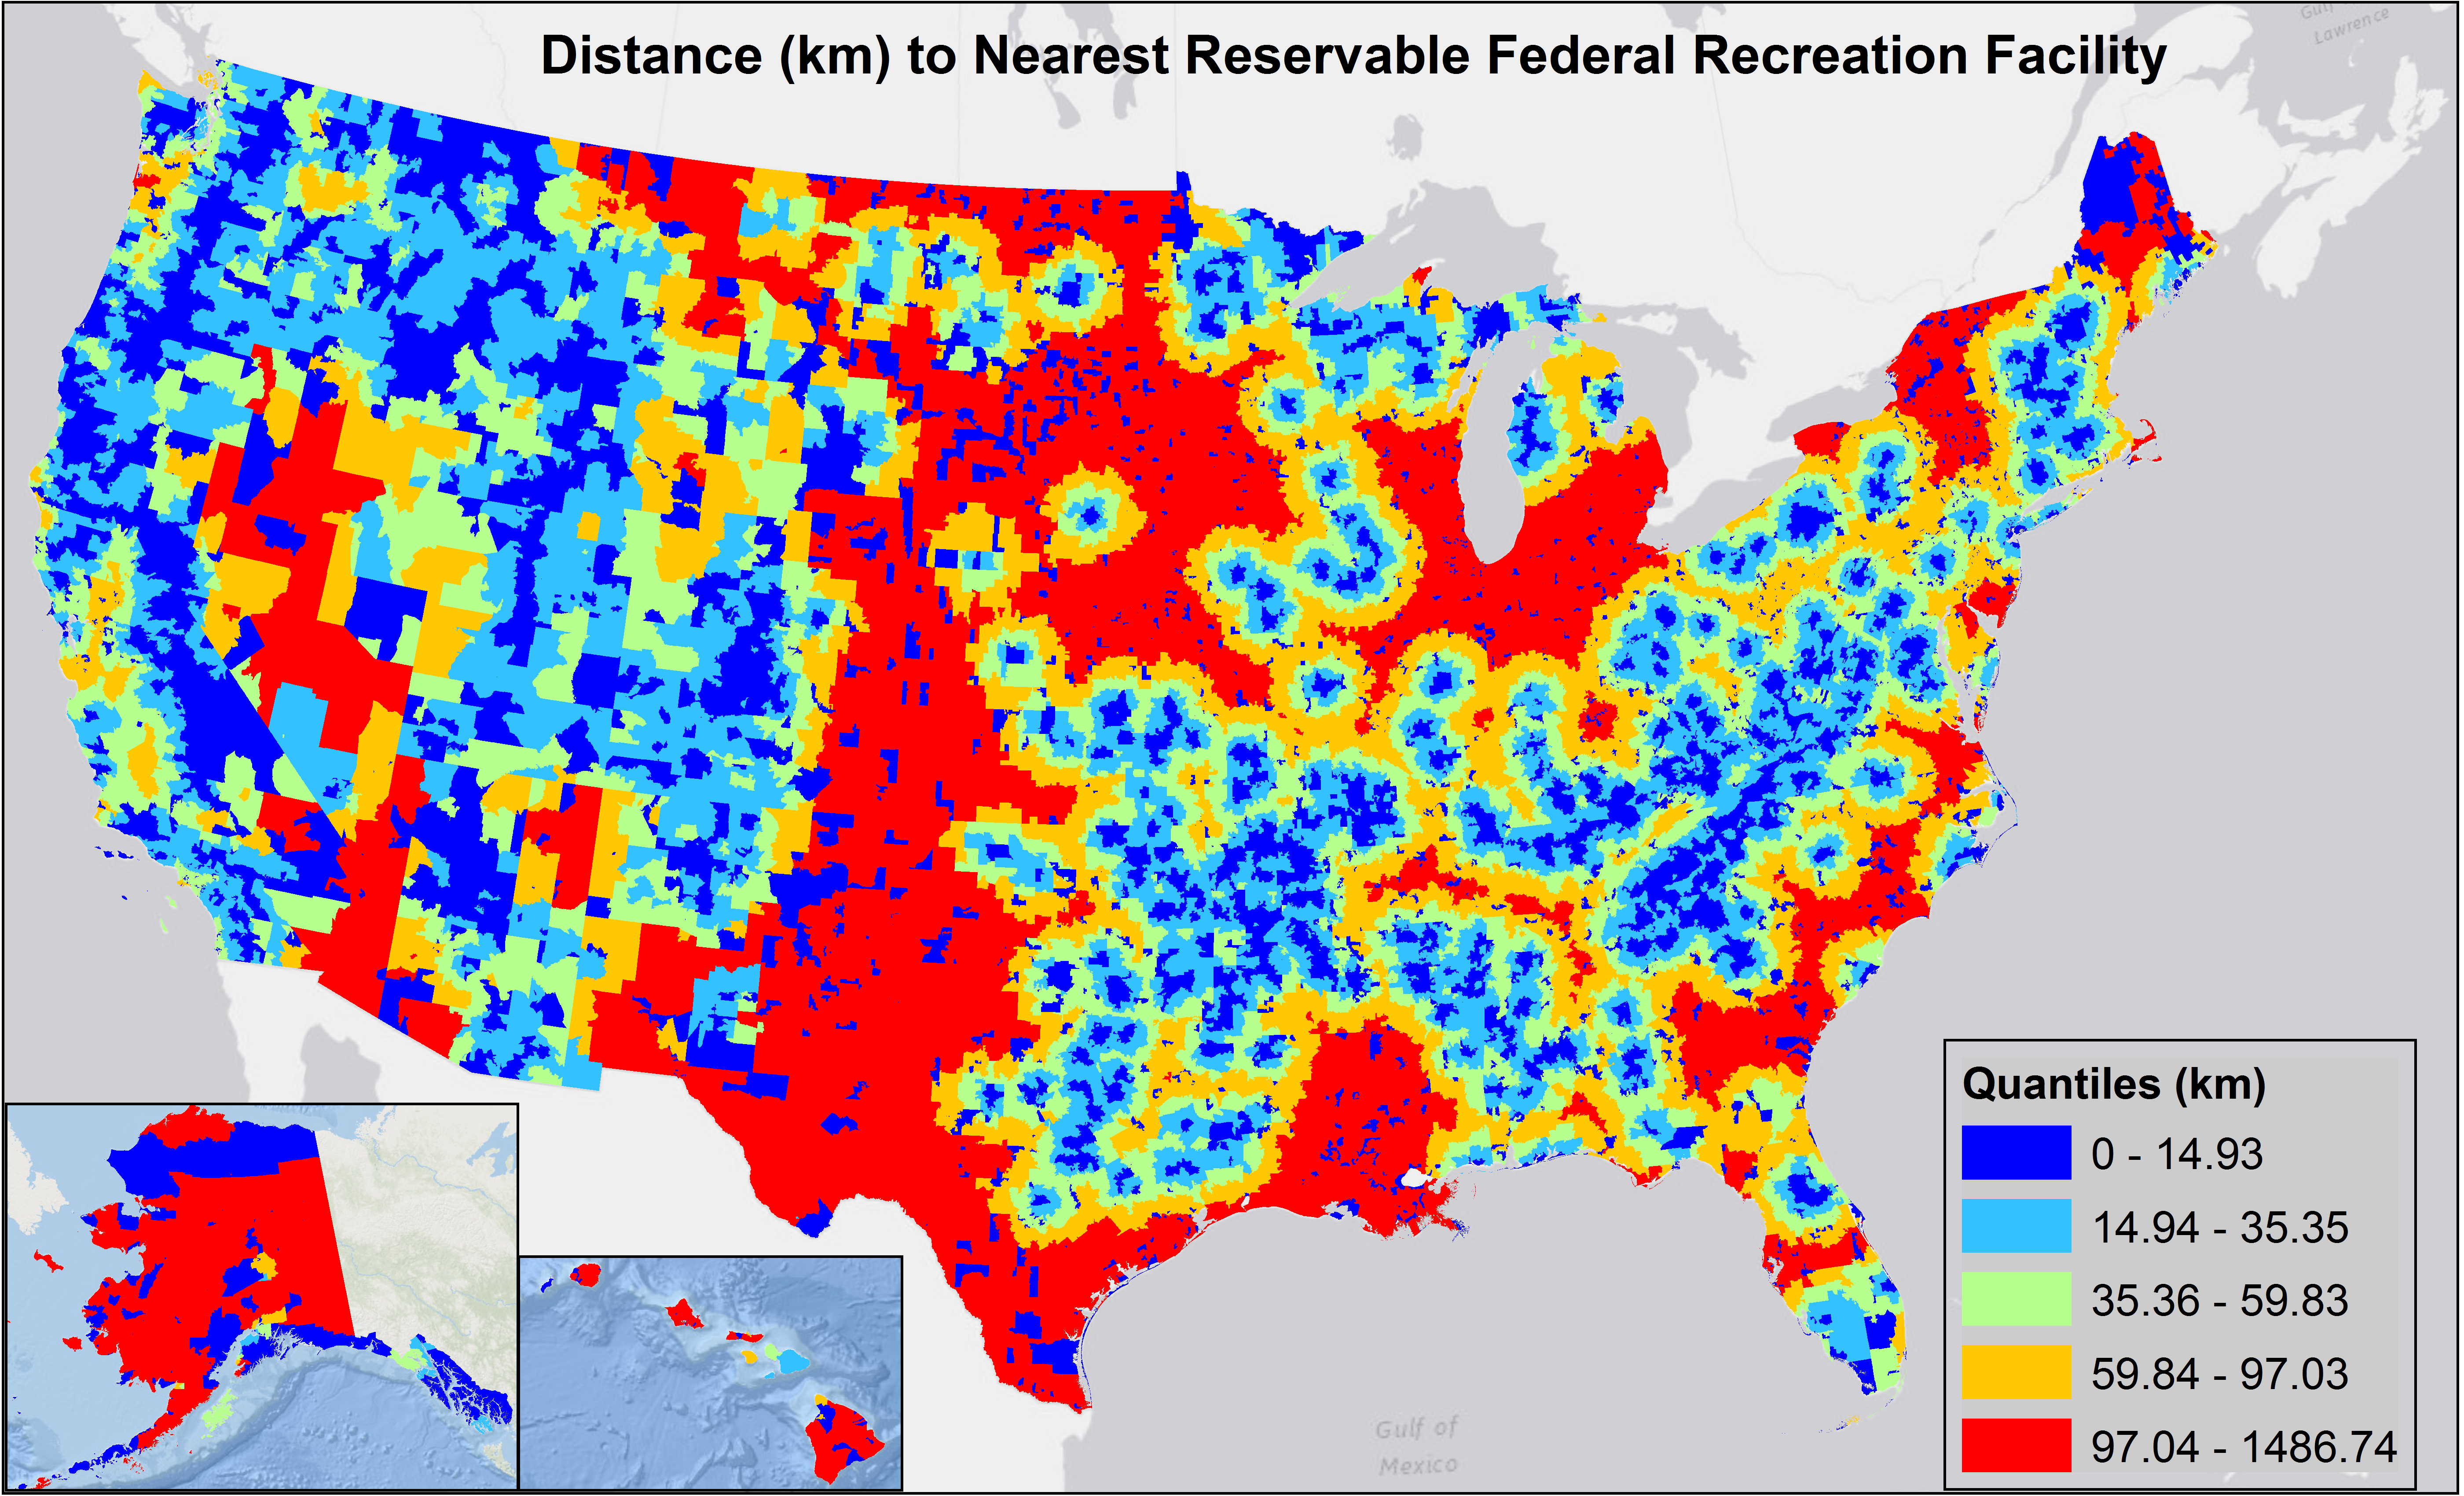
Some other data that we used we received directly from Parks officials at the hackathon, these files and conglomerate processed files of census data can be found in the github repository.
- Statistics: Multivariate linear regression
- Consider: Income, Race, Disability, Education, Age, Gender
- Problems: Uneven data distributions (not normal)
- Machine Learning: Decision Tree
- Can train the dataset and evaluate for accuracy
- Pros: More granular separation of communities
- Cons: Attention needs to be paid to not overfit the data
- Can also train different models on individual counties or states in the future
##Explore Our Results
Local website with cartdb, static map images and decision tree predictor in Node folder
##Conclusion
We discovered a list of bottom zip codes that may be targeted for improving park visitation. We also identified that education may be a top factor correlated to park visitation.
Future work may include identifying top zip codes that are close to a park and expresssing the attributes found our decision tree (low HS education levels) to be most correlated with low visitation of parks. We would also like to look into the zip codes that had no reservations at all despite having a population over 1000. Further variables and other orthogonal data (such as health data, more detailed education data and transportation data) could be included in our decision tree model to further improve results.
