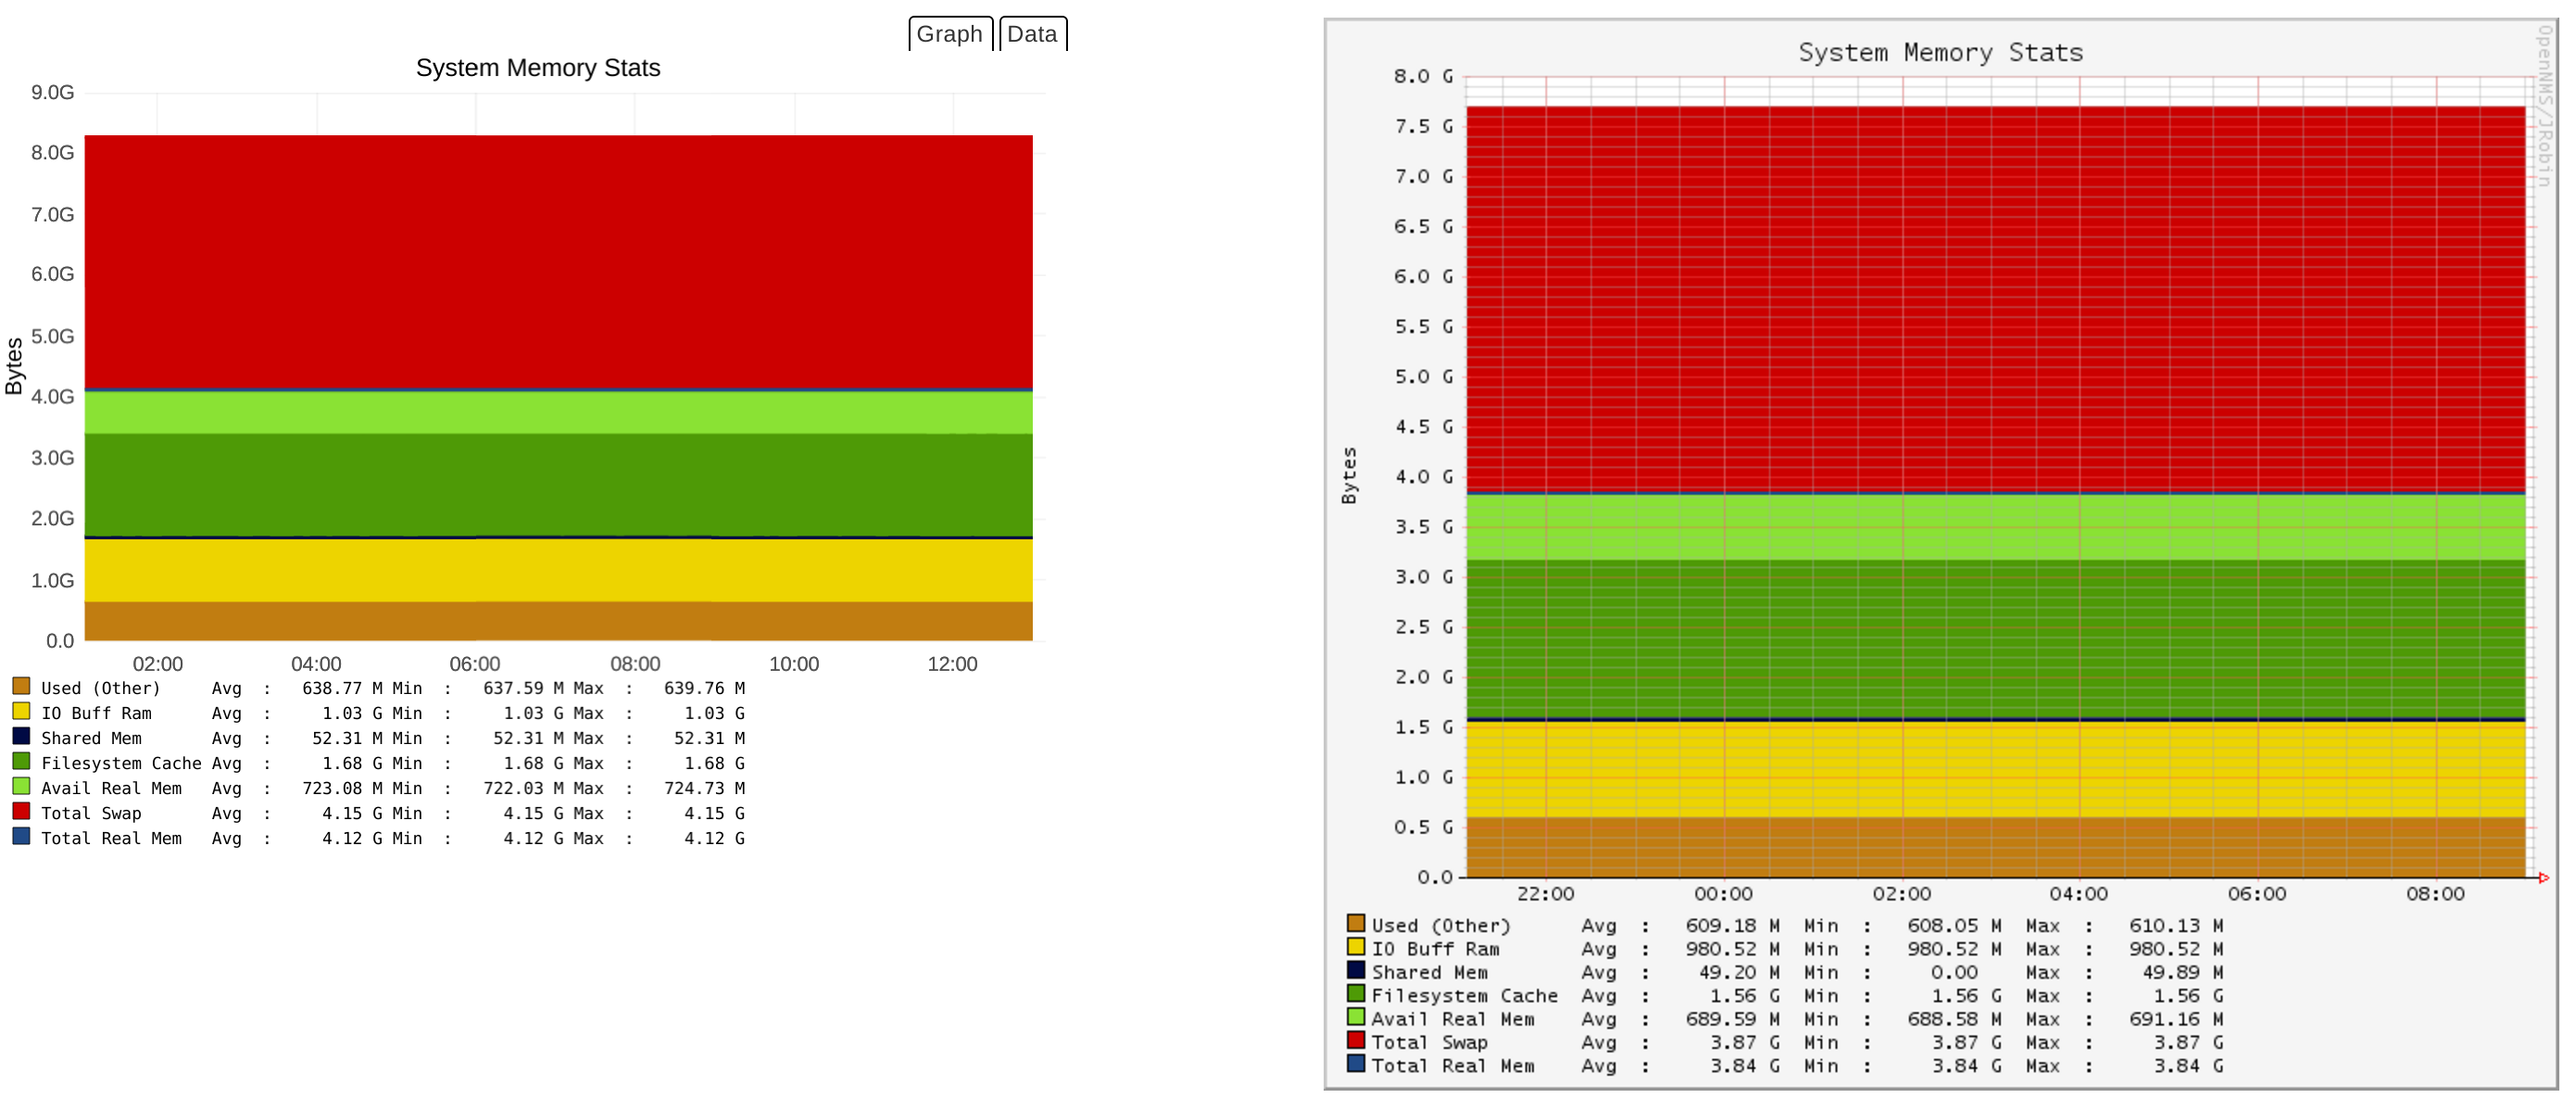
This library was built as an alternative to rrdgraph for use in OpenNMS.
As our needs grew, we began investigating alternative time series databases. One of the initial barriers to integrating these within OpenNMS was graphing: we needed a way for our users to visualize the metrics similar to how they were previously shown using rrdgraph. The system already contained a large number of prefabricated graphs defined using rrdgraph commands and any suitable alternative needed to a way of rendering these.
And thus Backshift was born at DevJam 2014.
Backshift provides the glue between data sources and charting APIs.
Charts and data sources are made accessible via a consistent API, allowing these to be easily interchanged.
The actual rendering of the charts is performed by third party libraries i.e. c3.js built to this end.
Install the dependencies and build the minified scripts:
npm install
npx grunt
Run the development web server:
npm start
Now browse to the examples at http://localhost:8000/examples/.
