Open Water Foundation JavaScript visualization library based on Leaflet
The repository contains multiple folders that contain examples of each type of visualization.
| Preview Link | Description |
|---|---|
Choropleth-Map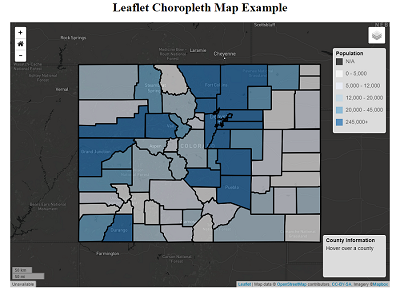 |
Choropleth Maps display divided geographical areas or regions that are colored, shaded, or patterned in relation to a data variable. |
Heat-Map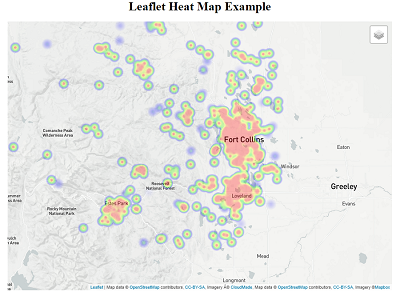 |
Heatmaps visualize data through variations in coloring. |
Point-Map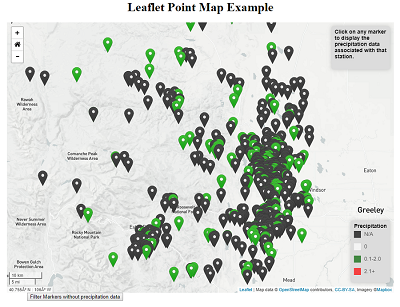 |
Point Maps are a way of detecting spatial patterns or the distribution of data over a geographical region. |
Dynamic-Zoom-Map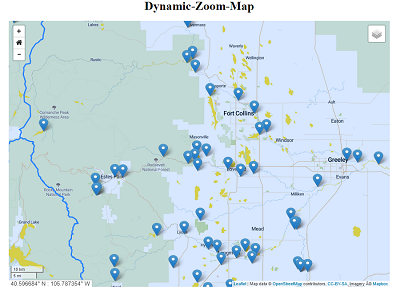 |
This map features icons that update based on the map's zoom level. |
Cluster-Map |
This map clusters together icons when zoomed out. |
Point-Symbol-Map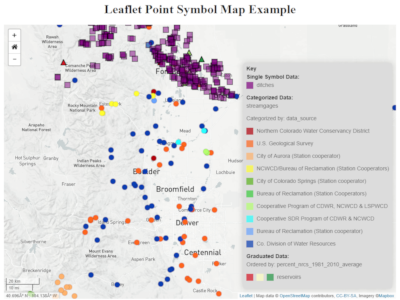 |
This map illustrates how to configure symbol properties for point layers, using a JSON map configuration file. |
Line-Symbol-Map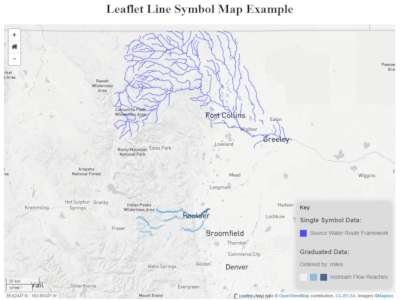 |
This map illustrates how to configure symbol properties for line layers, using a JSON map configuration file. |
Polygon-Symbol-Map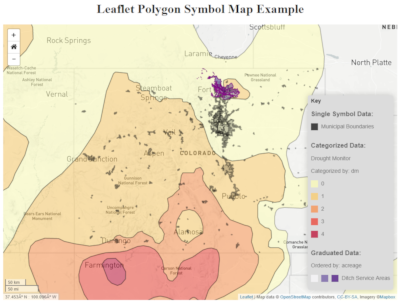 |
This map illustrates how to configure symbol properties for polygon layers, using a JSON map configuration file. |
Leaflet-Story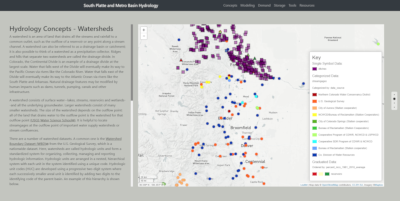 |
An example of a story with multiple leaflet maps created from a JSON configuration file, geoJSON data, and the javascript file js/map-files/leaflet-symbol.js that creates the maps. |
A standard development folder structure is recommended. The website development files can be set up as follows (Windows is assumed, but linux would be similar):
> C:
> cd \Users\user
> mkdir Leaflet-js
> cd Leaflet-js
> mkdir git-repos
> cd git-repos
> git clone https://github.com/OpenWaterFoundation/owf-lib-viz-leaflet-js
If you do not have a free Mapbox account, create one by going to the Account Creation page. Once you have created a Mapbox account, go to the Mapbox Studio page. Click on the styles tab on the left hand side of the screen. Select the purple New Style button in the top right corner of the screen. Once selected, leave the selected style as the default selection and give your style a unique name. For this example let's call it TutorialStyle. Once the style has been created, Mapbox should have redirected your webpage to a map of the world. In this view you can edit your map and customize it to look however you want. For further documentation on editing a map refer to the link below:
Now click on the Style tab again and select the 3 lined bar tab next to the style you just created. Once selected, a popup should display. Select the Share, develop & use option. There should be an option now that says Develp with this style. Select the leaflet tab and than you can copy that link into your leaflet map.
Leaflet is an open source web mapping library that forms the basis of Mapbox.js. It is software that works on web pages and makes interactive maps possible. Leaflet requests tiles from servers like Mapbox, displays and animates them, and supports other overlays.
See also: