Flatiron Data Science Project - Phase 3

Prepared and Presented by: Melody Peterson
Presentation PDF
Blog Post
A Terry stop in the United States allows the police to briefly detain a person based on reasonable suspicion of involvement in criminal activity. Reasonable suspicion is a lower standard than probable cause which is needed for arrest. When police stop and search a pedestrian, this is commonly known as a stop and frisk. When police stop an automobile, this is known as a traffic stop. If the police stop a motor vehicle on minor infringements in order to investigate other suspected criminal activity, this is known as a pretextual stop. - Wikipedia
This classification project attempts to determine the possible demographic variables that determine the arrest outcome of a Terry stop. Modeling is done for inference only as making prediction with the model would be incorporating any possible human bias into the model.
This data represents records of police reported stops under Terry v. Ohio, 392 U.S. 1 (1968). The dataset was created on 04/12/2017 and first published on 05/22/2018 and is provided by the city of Seattle, WA. There were 45,317 rows and 23 variables. The classification target is ‘Arrest Flag’. Initial ‘Arrest Flag’ distribution ‘N’ - 42585, ‘Y’ - 2732
In the initial data cleaning/scrubbing phase, place holder values and missing values were treated in ways to best retain as much data as possible while keeping the integrity of the data. Generally, missing values were binned together into 'Unknown' categories as can be seen in the histograms below.


Once the data had been cleaned, initial models were run to help determine if there were any confounding variables as suspected in Stop Resolution. Issues were found with a feature engineered category of Subject Known Unidentified where none of the data points in this category were positive for the target. Date was also proving to be confounding because none of the positive target records had occured before a certain date.


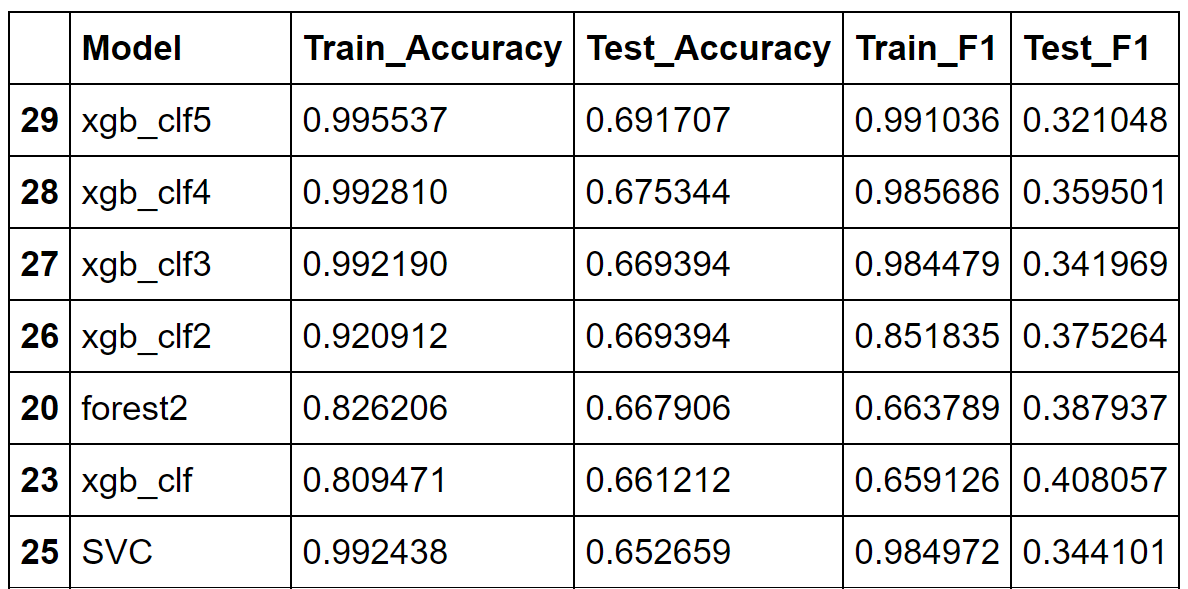
An initial baseline model was created using a dummy classifier, and then several models were run and parameters tuned to find the most accurate model.
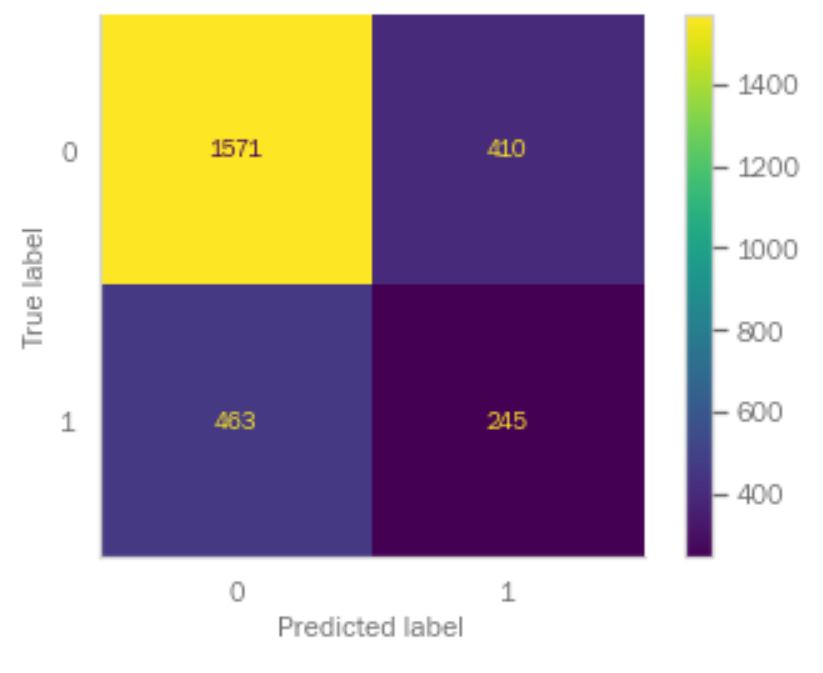
For the final model, you can see in this graph how the model classified the data versus the actual classifications of the data. Test accuracy of 67% means 32.46% of data misclassified. Of 708 arrests, 35% were classified as arrests. There were 245 true positives and 63% of positives were misclassified.
The features importances of the two top performing model types show very little in common.


- Call Type of 911 appears to be important to the models
- Other 'Unknown' variables need to be reassessed
- Recommend engineering new target and features and remodeling
- Further analyze unknown or missing values
- Update ‘Arrest Flag’ with arrest values from ‘Stop Resolution’
- Try no SMOTE
- Tune Support Vector Classification

