This repo is an attempt to use data to explore the claims in Python Displacing R As The Programming Language For Data Science and The homogenization of scientific computing, or why Python is steadily eating other languages’ lunch.
The individual files contain the R code that I used to gather data from each source, and the results are summarised below. I've made no attempt to separate python for data analysis from other uses of python, but hopefully the signals are still indicative. If you think my methodology is wrong, or you have other ideas for data sets, please send a pull request and I'll merge it in.
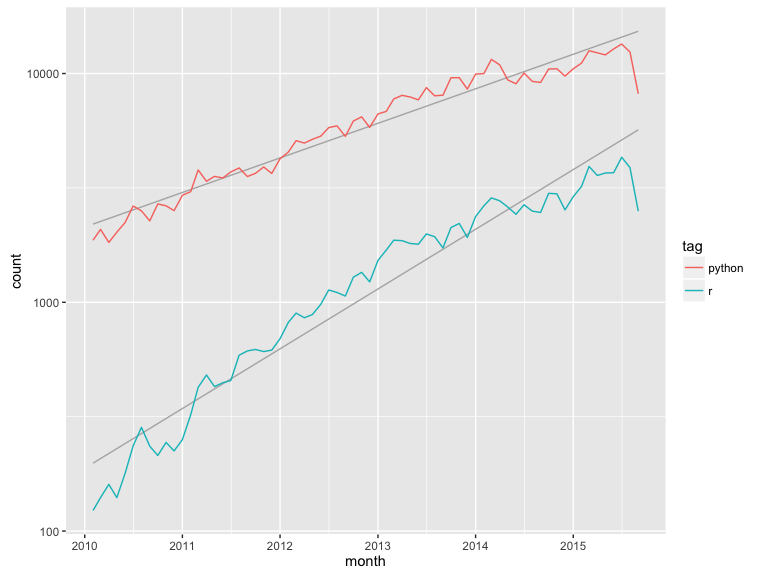
Using the stackexchange data explorer, I calculated the number of questions asked by month for both python and R. Overall, both R and python questions are growing explosively over time:
A little further exploration (not shown) indicates that this is very close to being exponential growth.
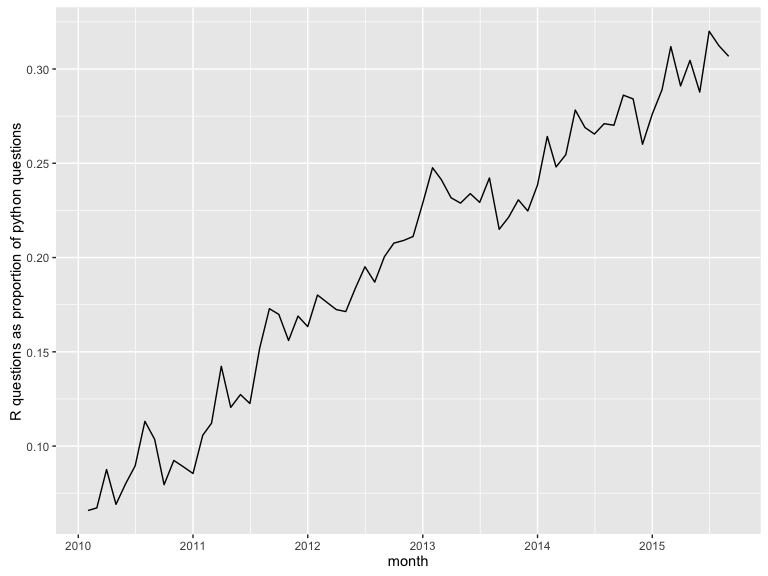
If we standardise the number of R questions by the number of python questions, we see that the number of R questions is increasing more rapidly than python. Currently, about 1 question about R is asked for every three questions asked about python.
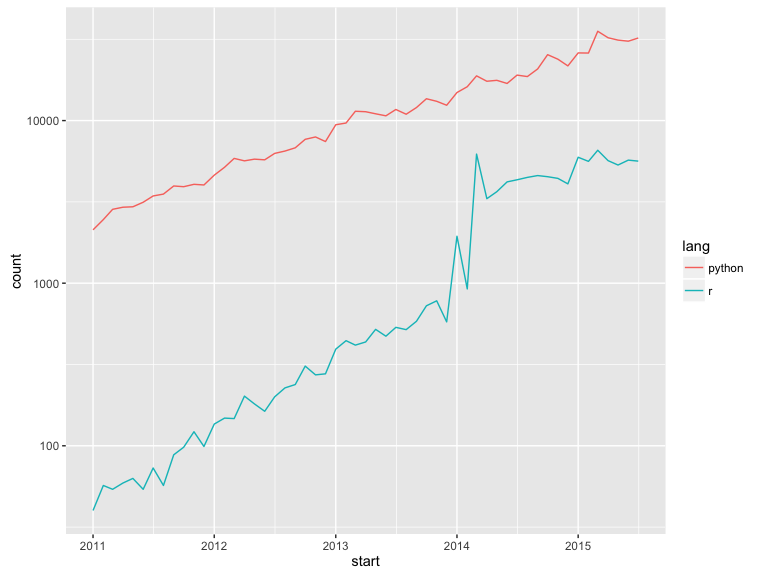
Again we see exponential growth in both repos containing R code and repos containing python code (these number don't include forks), but R repo's are relatively less common than R questions. The big jump in repo creation in 2014 is probably due the JHU coursera course.
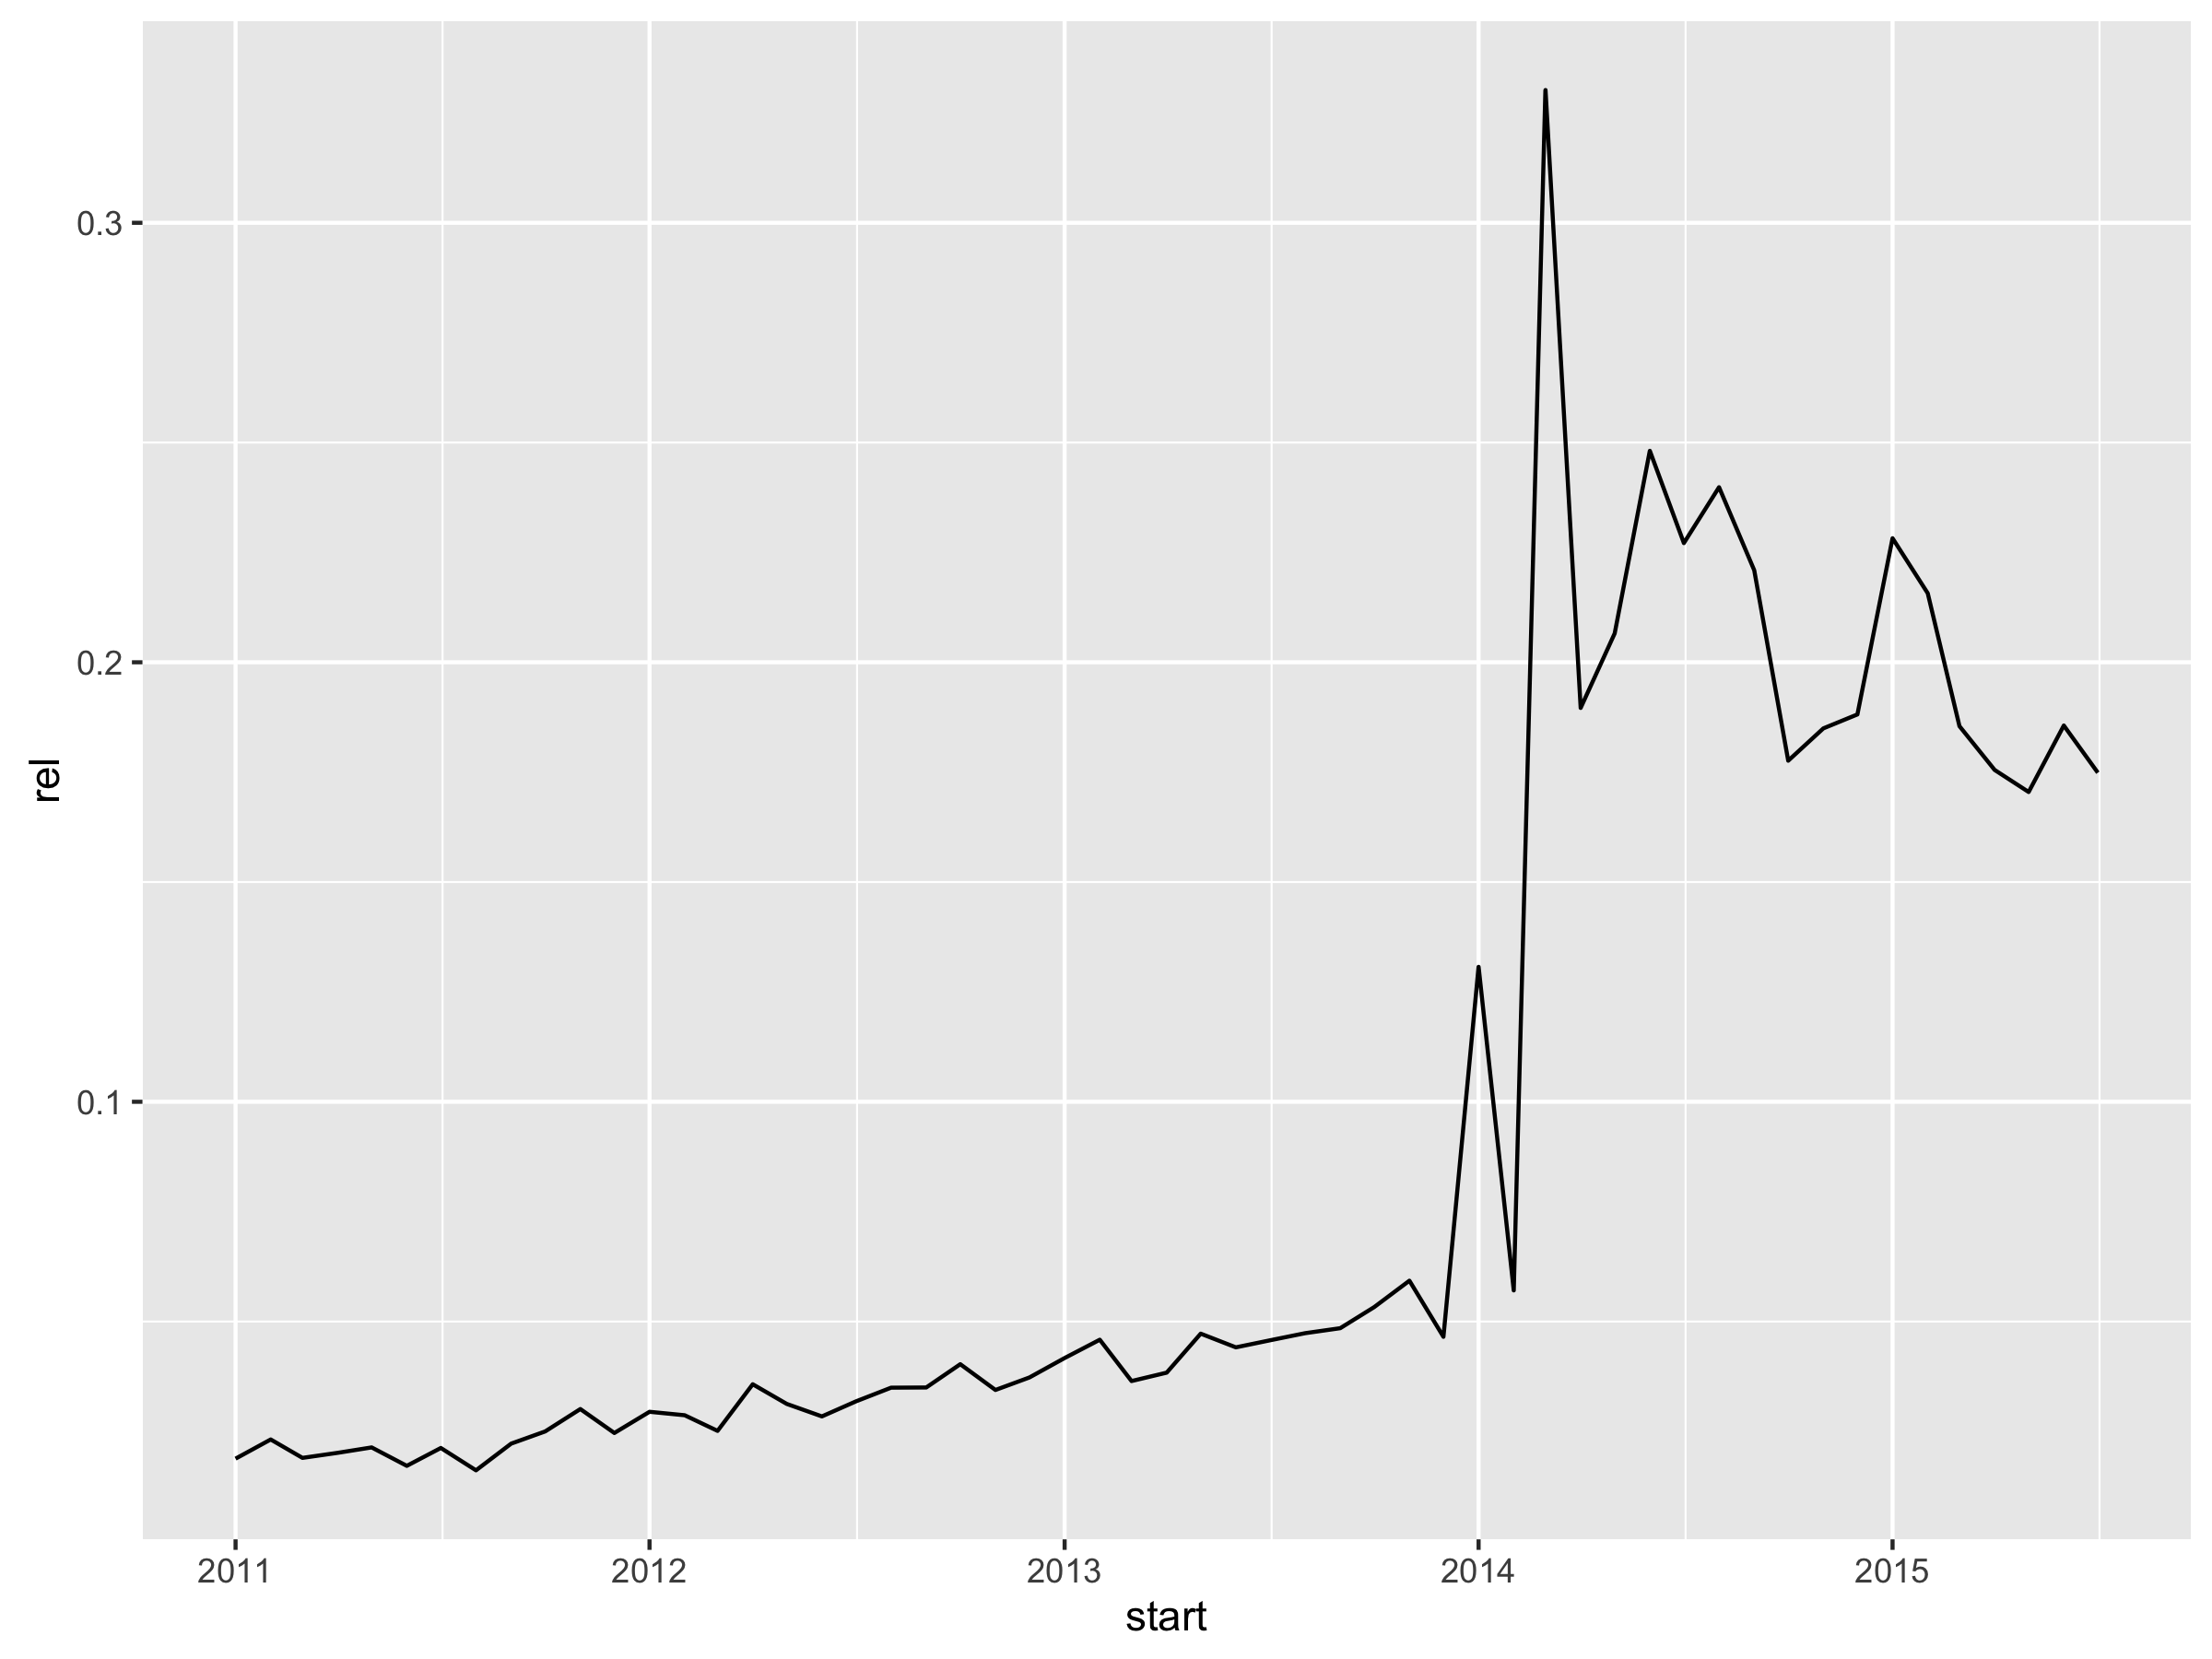
If we standardise the number of R repos by the number of python repos, we see that R has been decreasing since the big jump in 2015.
Looking at google trends data for people searching for language tutorials, both languages are relatively flat. Growth in searches for R tutorials is relatively flat, perhaps with a slight increases, while growth for python searches has been considerably more variable over time.
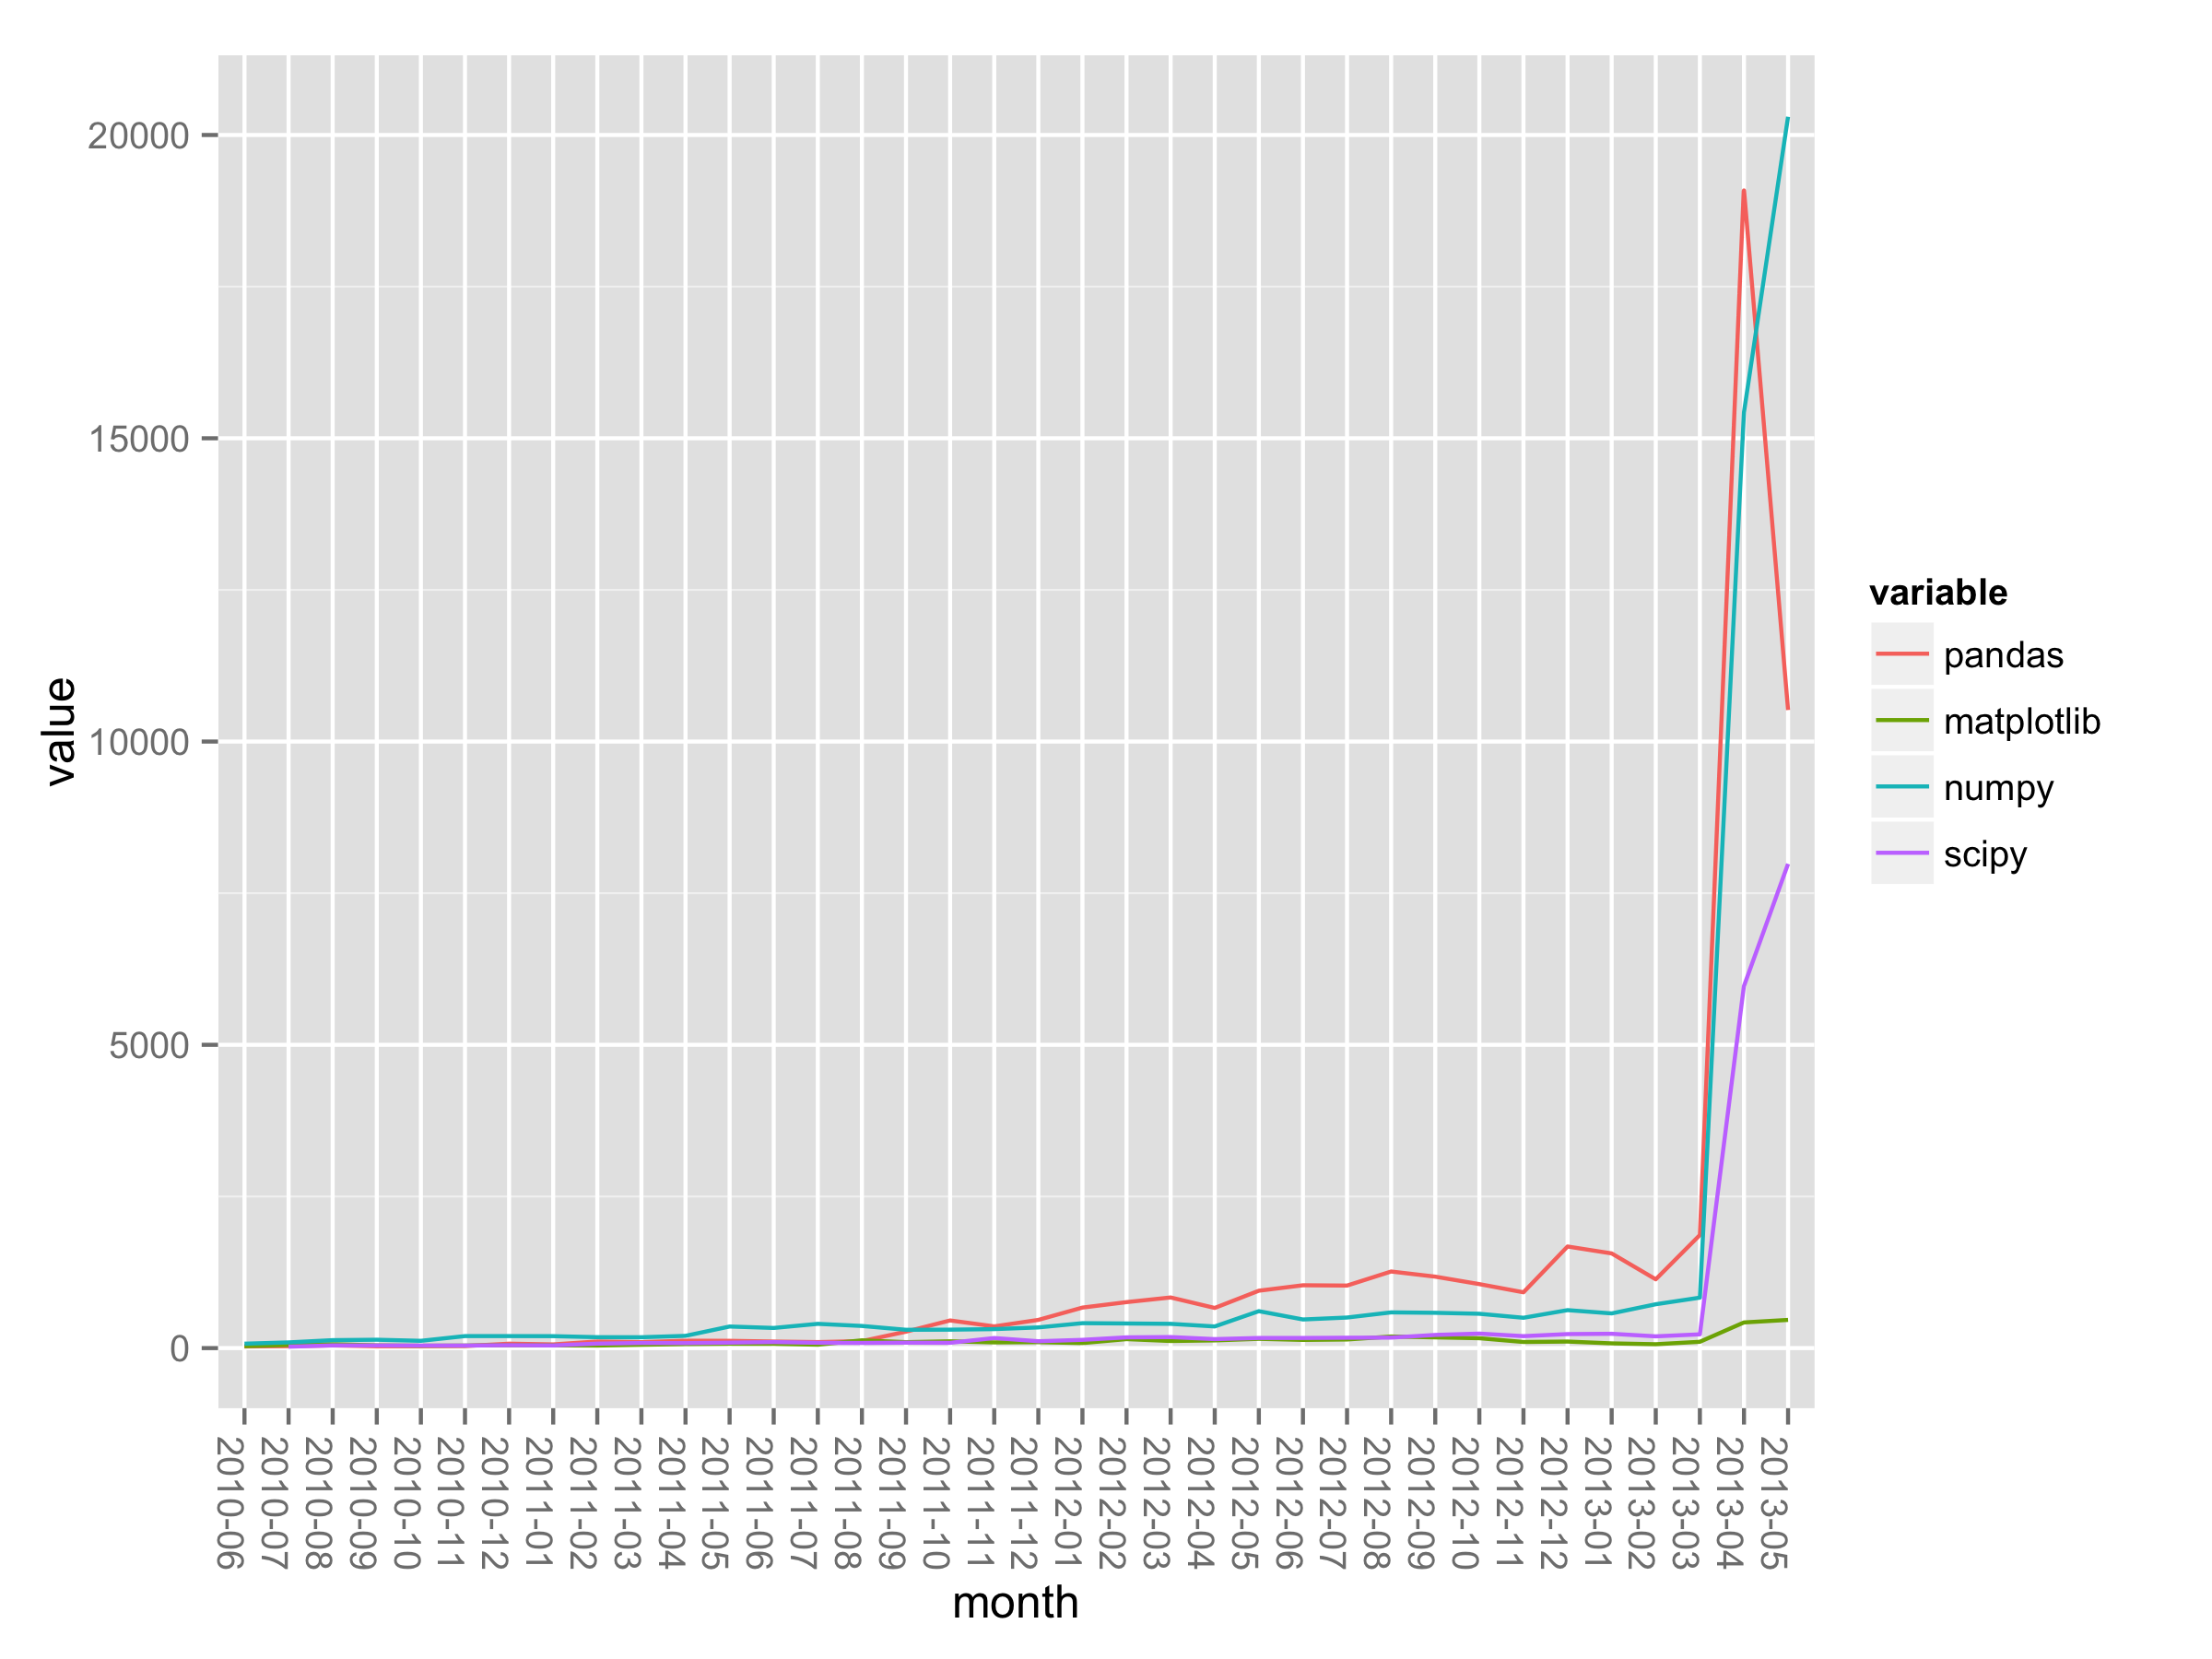
This is the data of monthly downloads made available from the Python PyPi Package Index. The plot shows the growth in several data analysis packages for Python. Somethig happens in March, 2013 when the growth explodes.
- Look at use of mailing lists. Is there a pydata specific mailing list?
- Compare twitter hashtags: rstats, python, pydata?
- Compare package downloads?
- Number of Kaggle solution scripts written in R versus Python.
- Number of Machine Learning courses on MOOC sites that use R versus Python.
- Compare attendees at big R versus big Python data conferences year-over-year.
