You can view the application in:
Alternatively, you can look at https://youtu.be/SEYXEcVKt38 for a live demo.
But because I'm hosting it free on pythonanywhere, speed of website can be (very) slow when traffic is high.

You are encouraged to host it locally on your computer, where the speed is much faster.
This website will be free forever! No subscription needed! But if you want to support me, please give me a star on Github or you can PayPal to paypal.me/stocksera
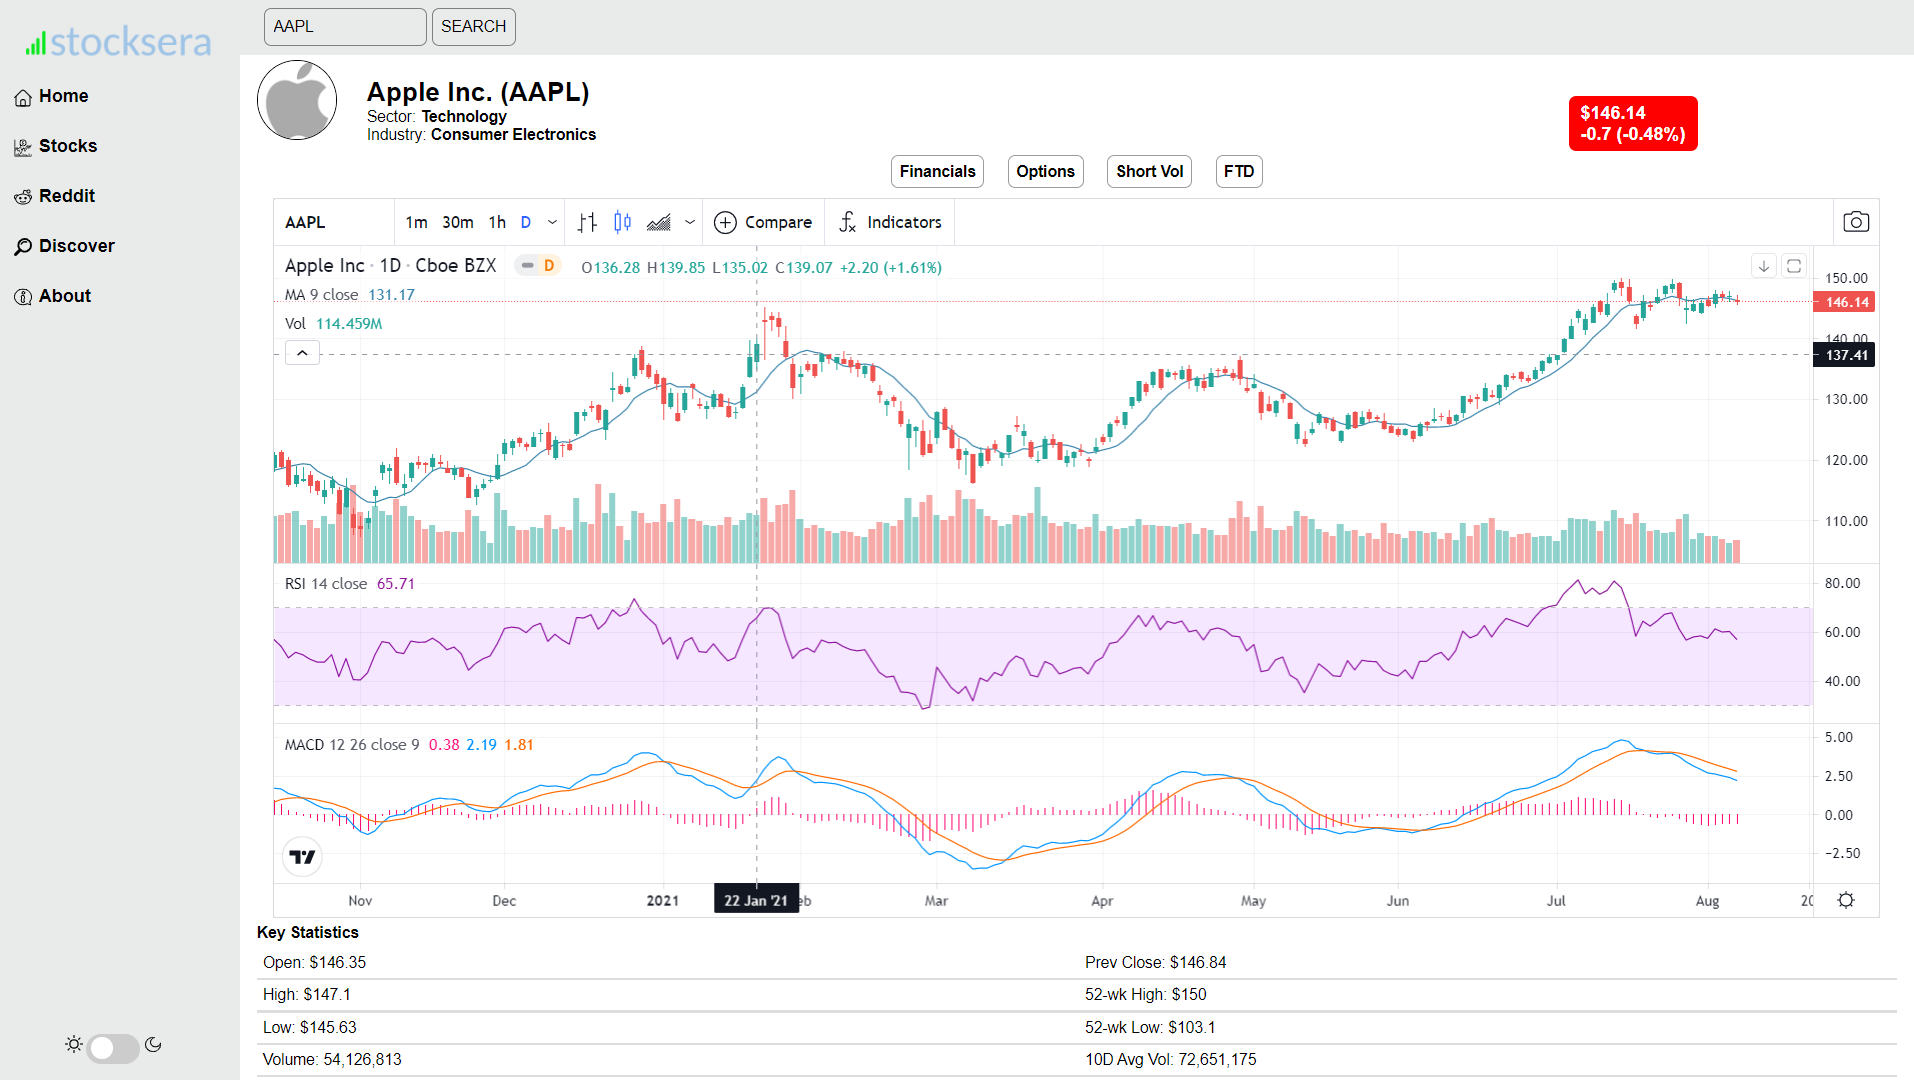
- View graph/historical data of your favourite ticker.
- Gather key statistics such as EPS, beta and SMA.
- Proportion of stocks held by major holders and major institutions.
- Google trending.
- Data is from yahoo finance

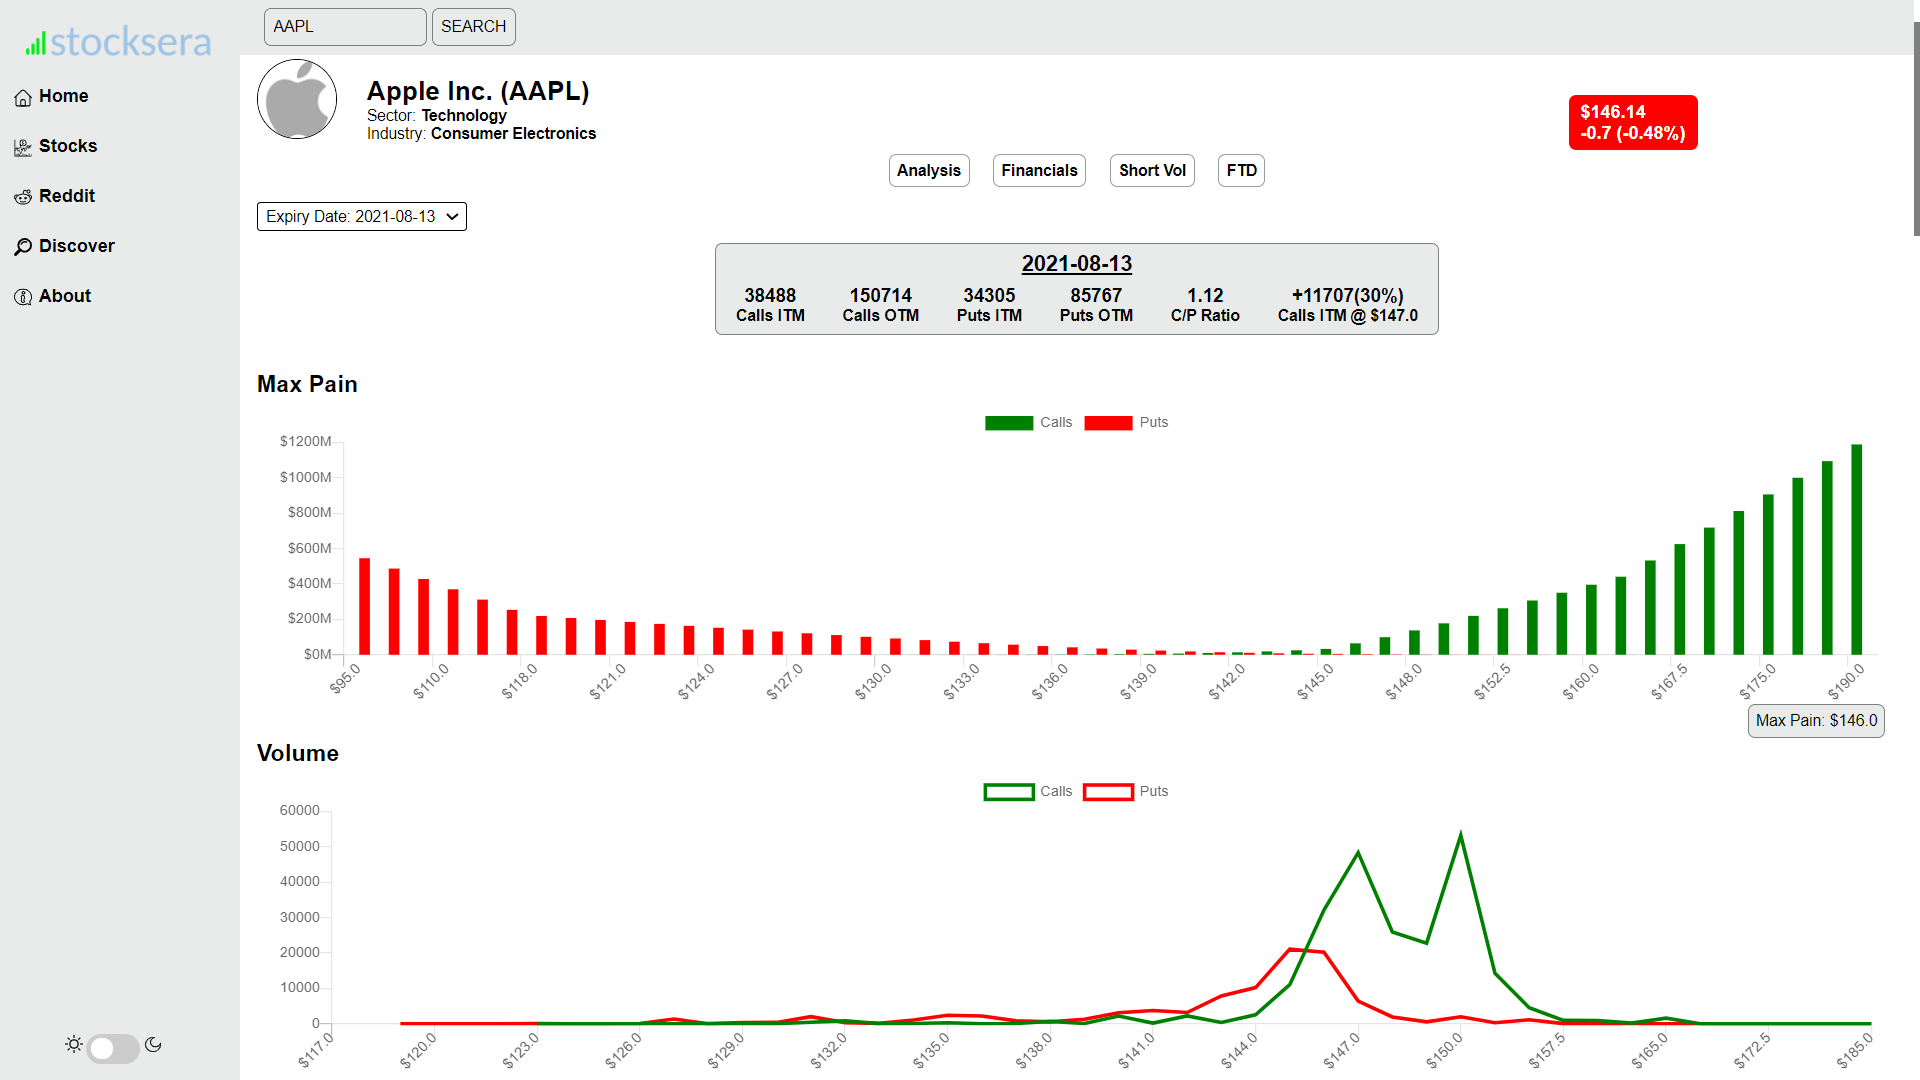
- View options chain of your favourite ticker. Inspired from Gamestonk Terminal
- Find out the max-pain price, OTM & ITM options and Call/Put ratio of the next few weeks.
- NOTE: Options chain and max-pain price are updated real time. Hence, there may be a slight delay in rendering this page.
- Data is from yahoo finance

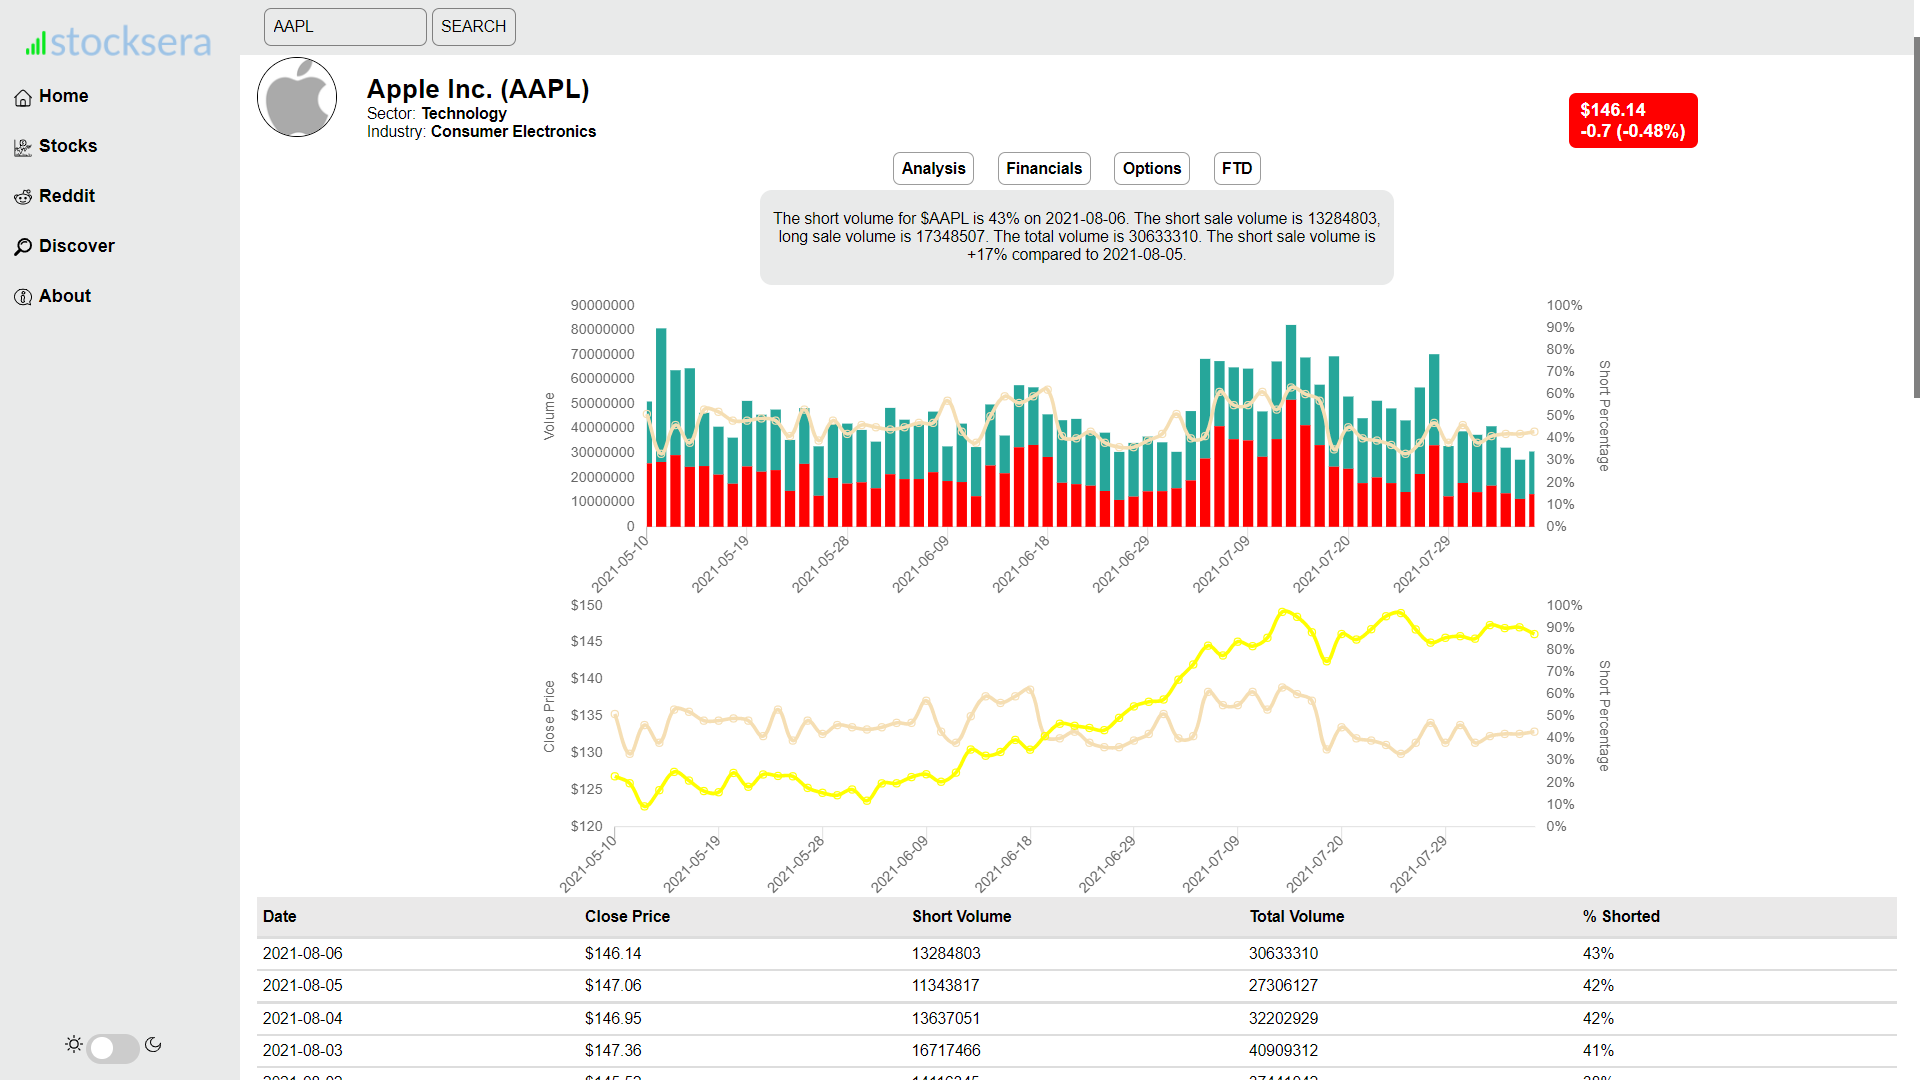
- View short volume and short percentage of some of the popular tickers.
- Data is from shortvolumes.com

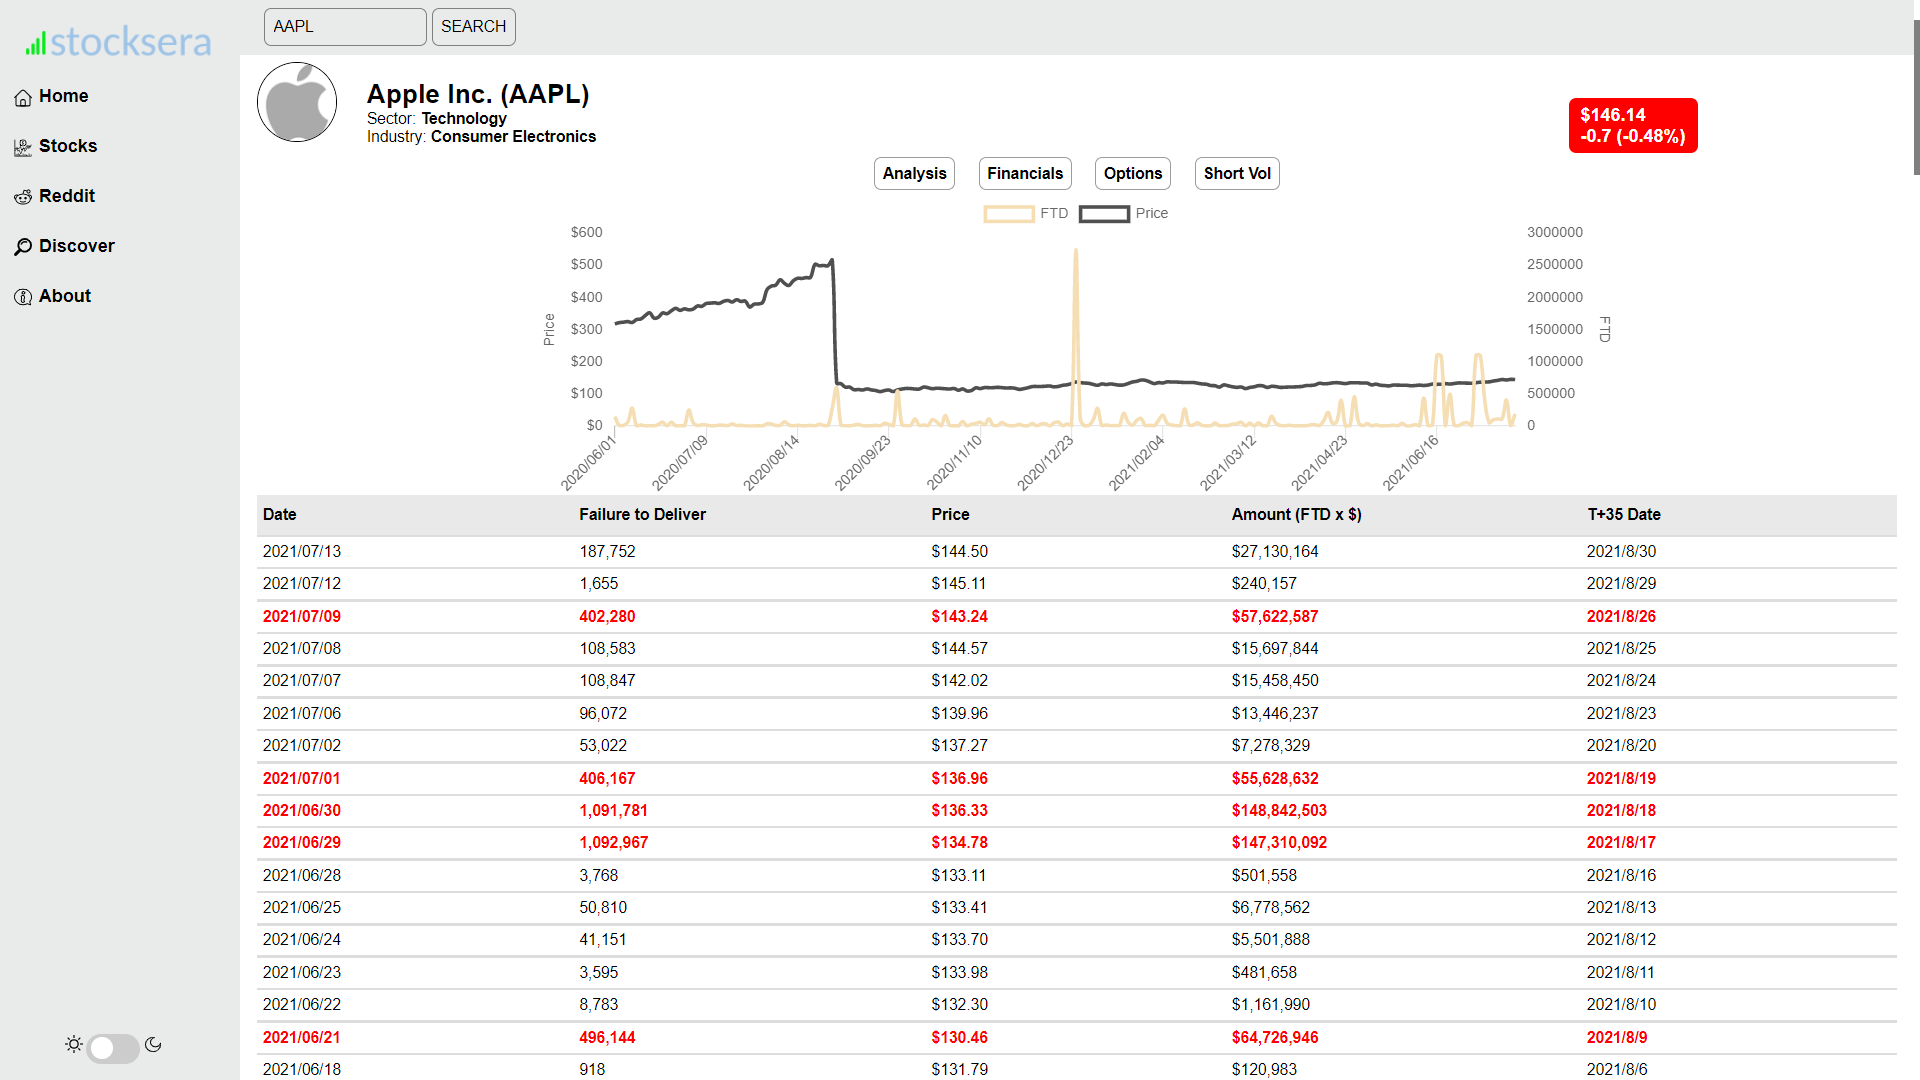
- View failure to deliver data of some of the popular tickers.
- Data is from SEC.gov

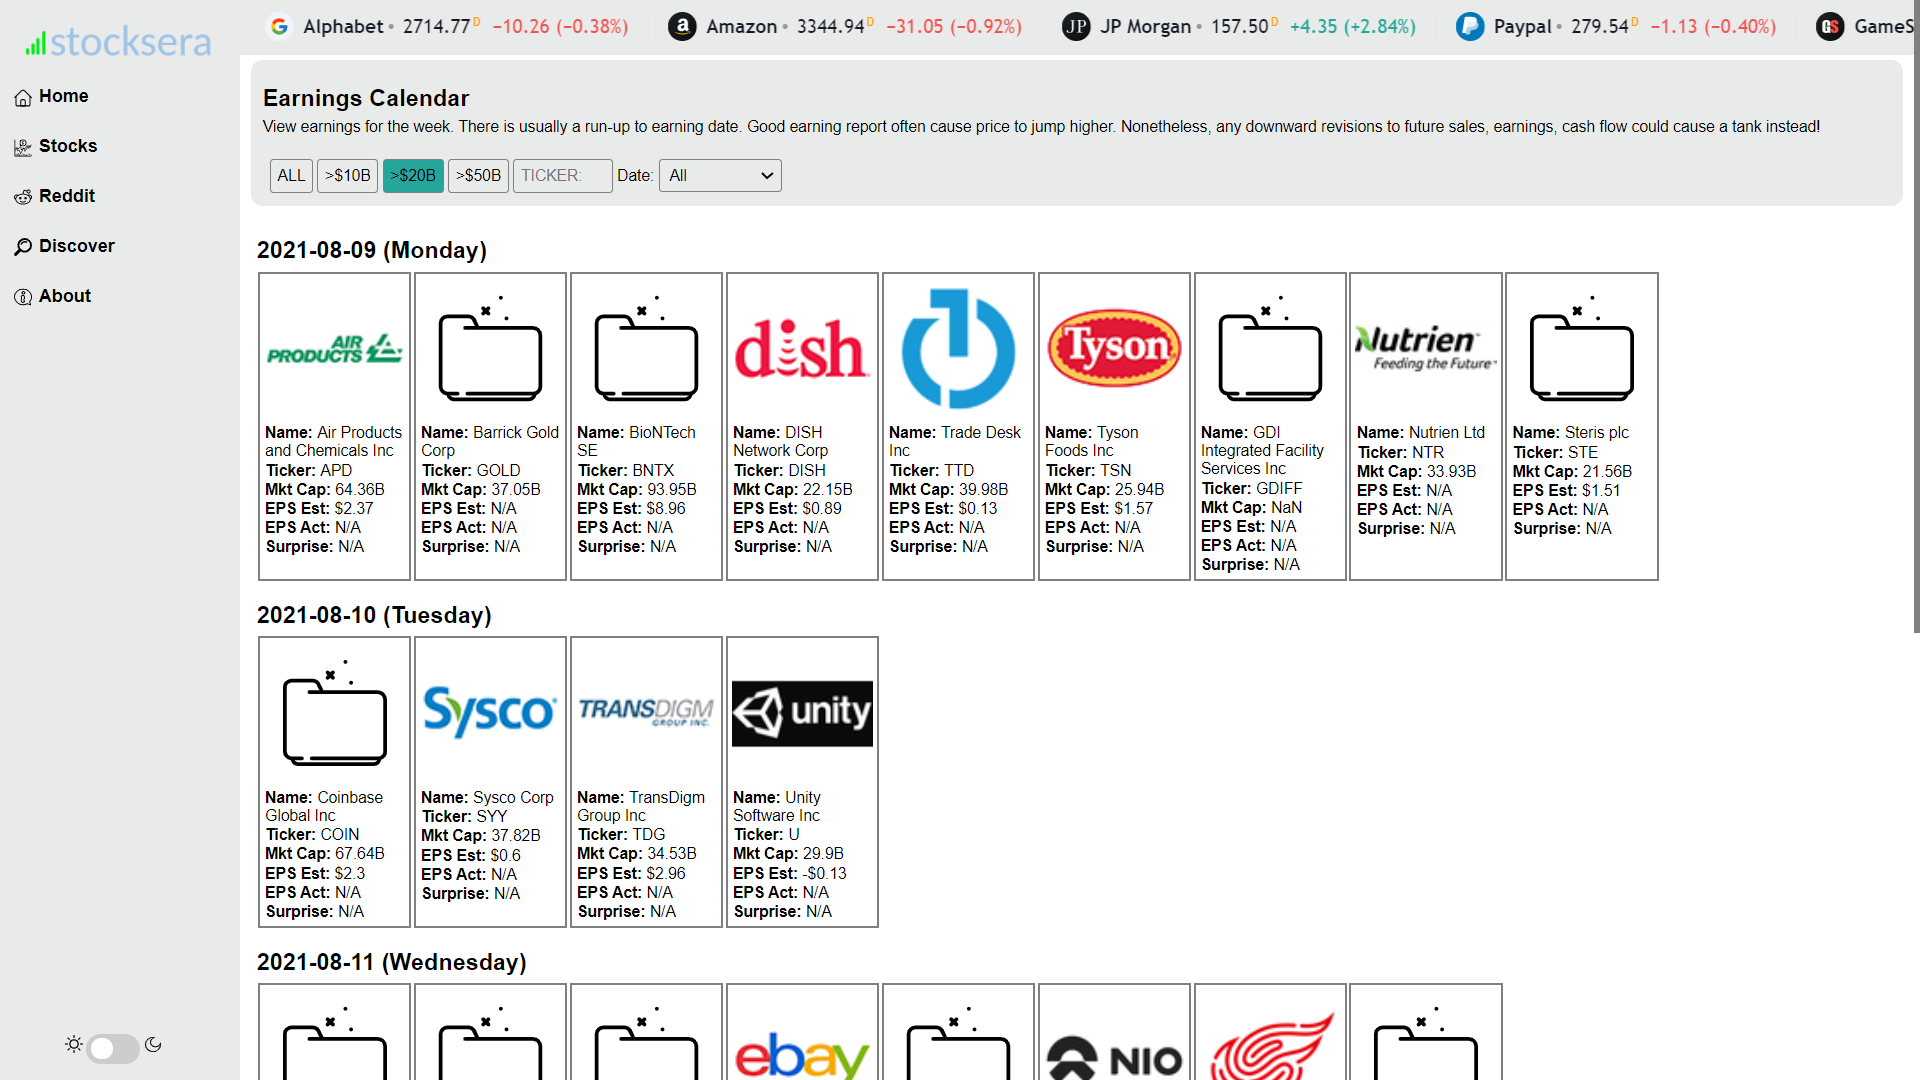
- View all tickers earnings report for the week ahead
- Market Cap, EPS Estimate and EPS Actual
- Sortable by market cap and day
- Data is from yahoo finance

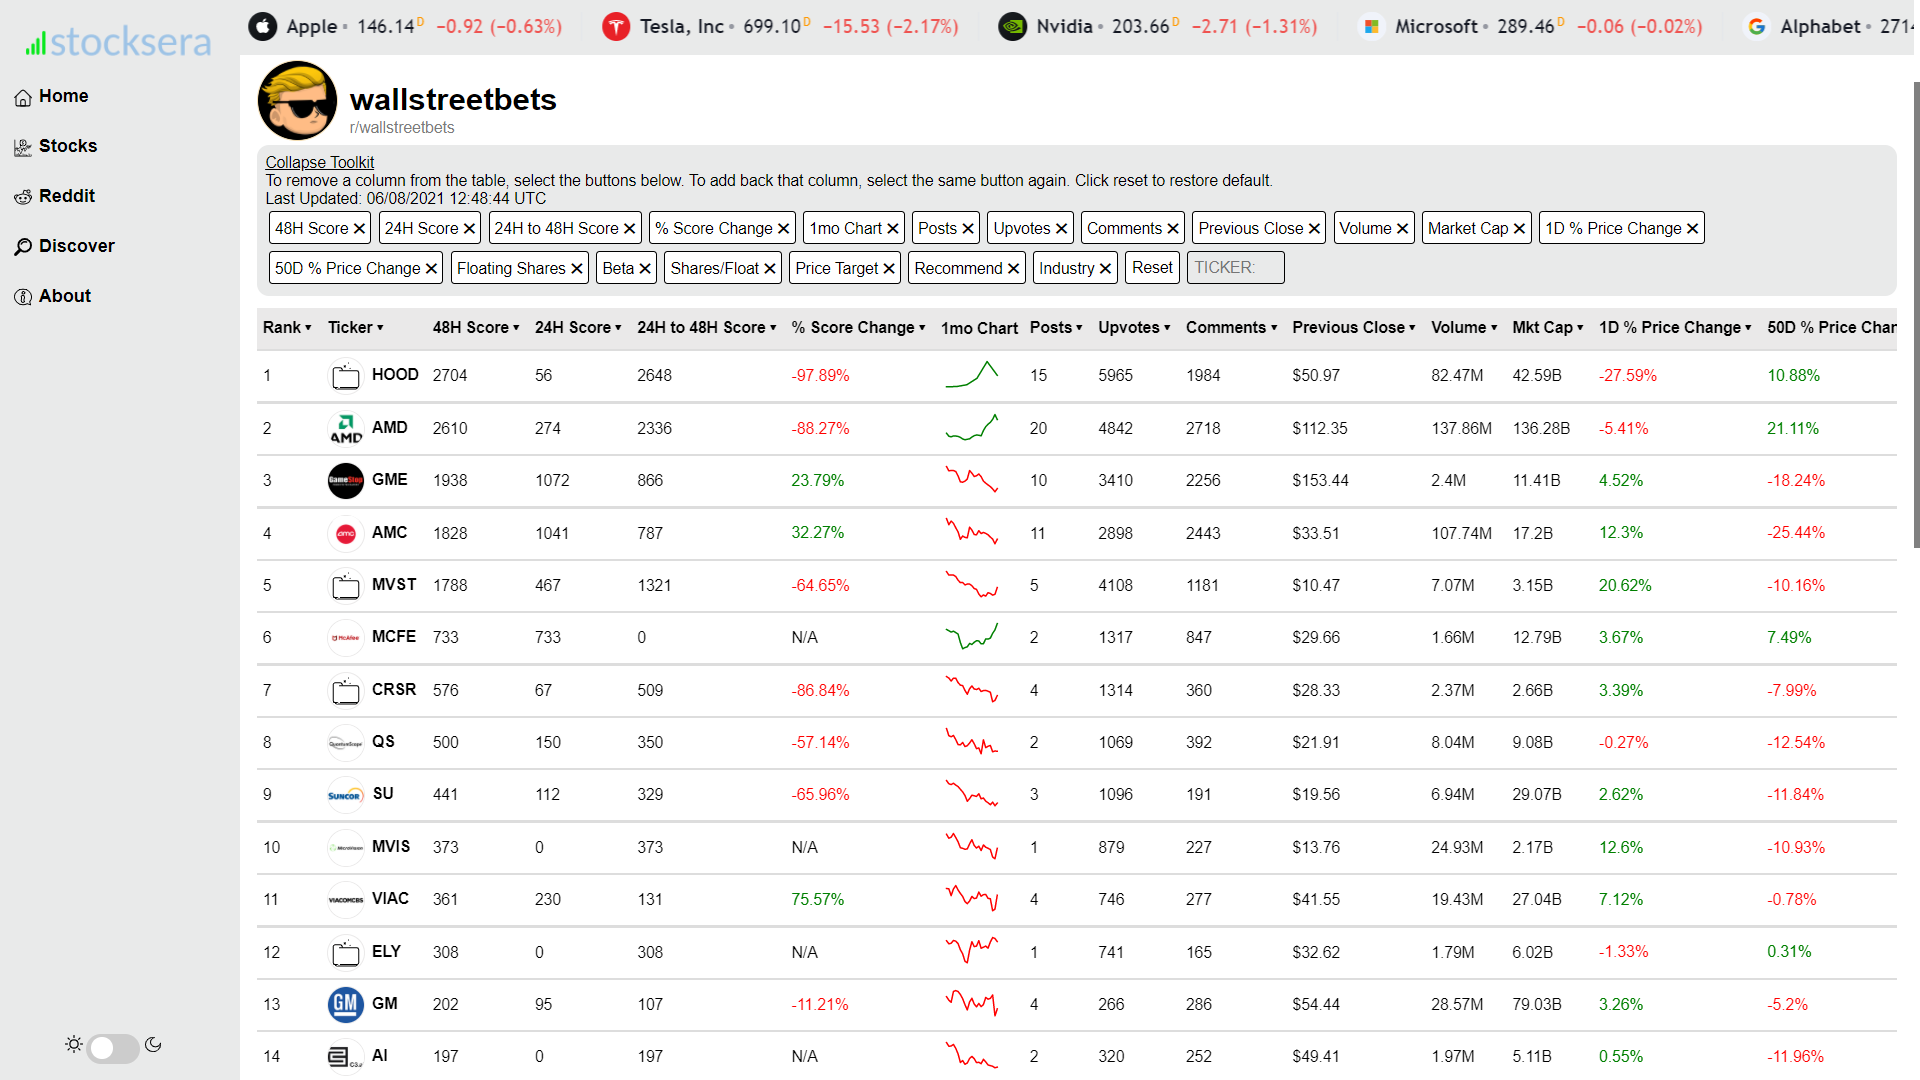
- Find the most mentioned tickers with their sentiment level on different subreddits such as r/wallstreetbets, r/stockmarket and r/stocks. Inspired from Auto DD
- Data is updated daily, around 1 hour before market open.

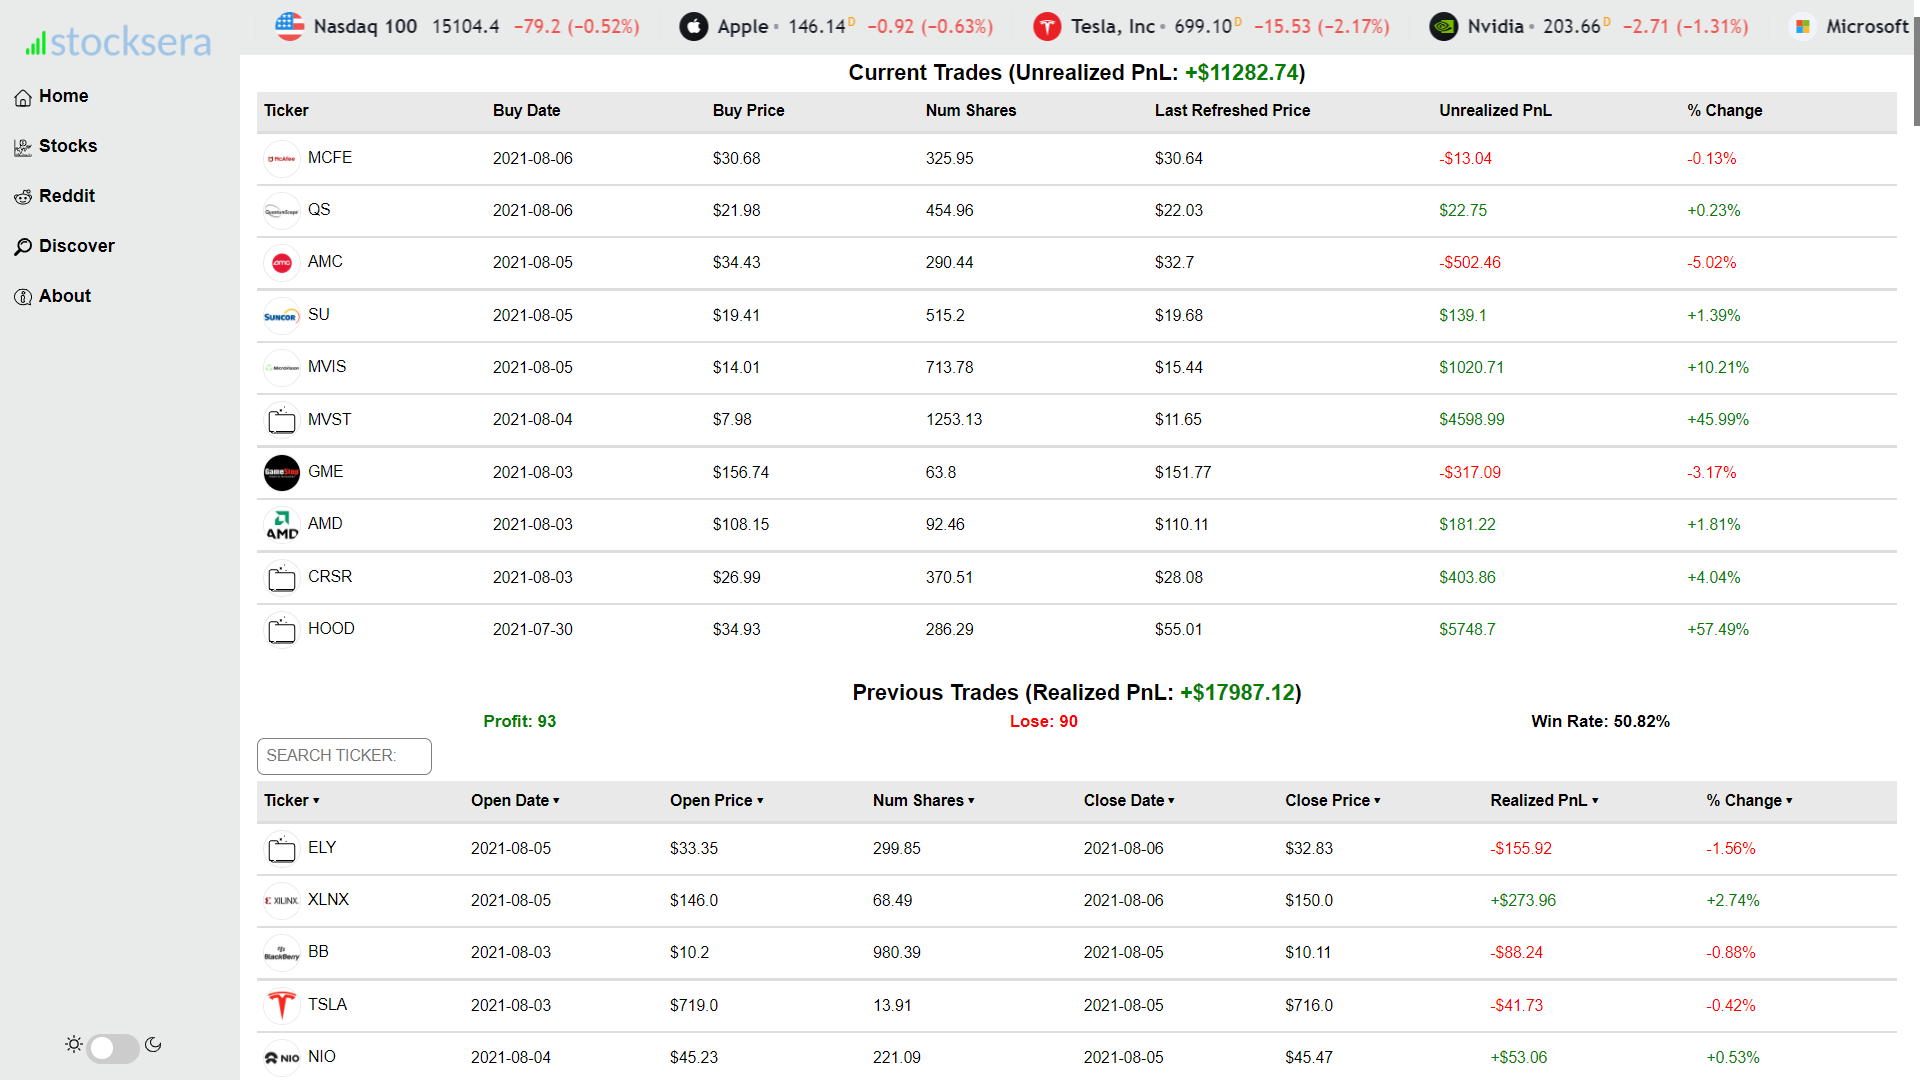
- Analyse the performance of trending tickers on r/wallstreetbets.
- Top 10 most mentioned tickers with the highest sentiment will be added to the "Reddit ETF" when market opens.
- Tickers that fall outside the Top 10 list will be sold.

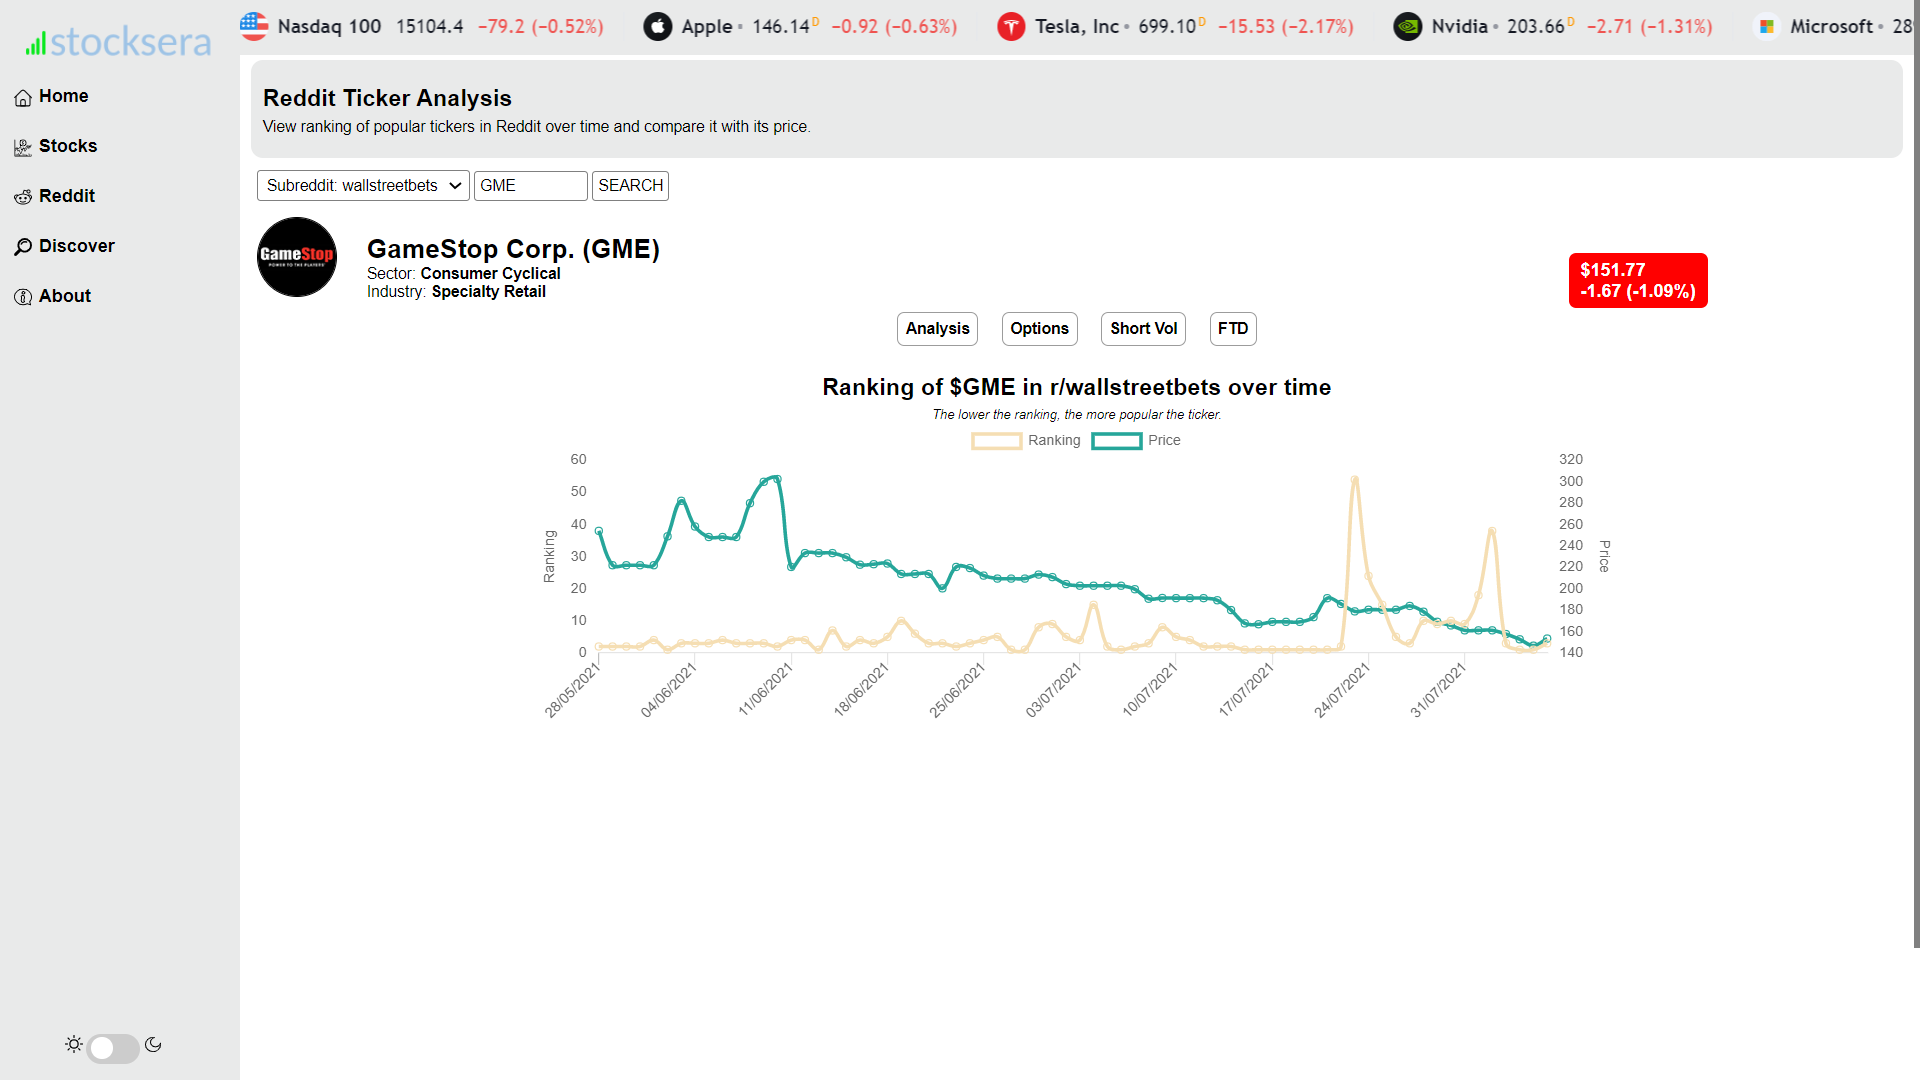
- View ranking of popular tickers in Reddit over time and compare it with its price.

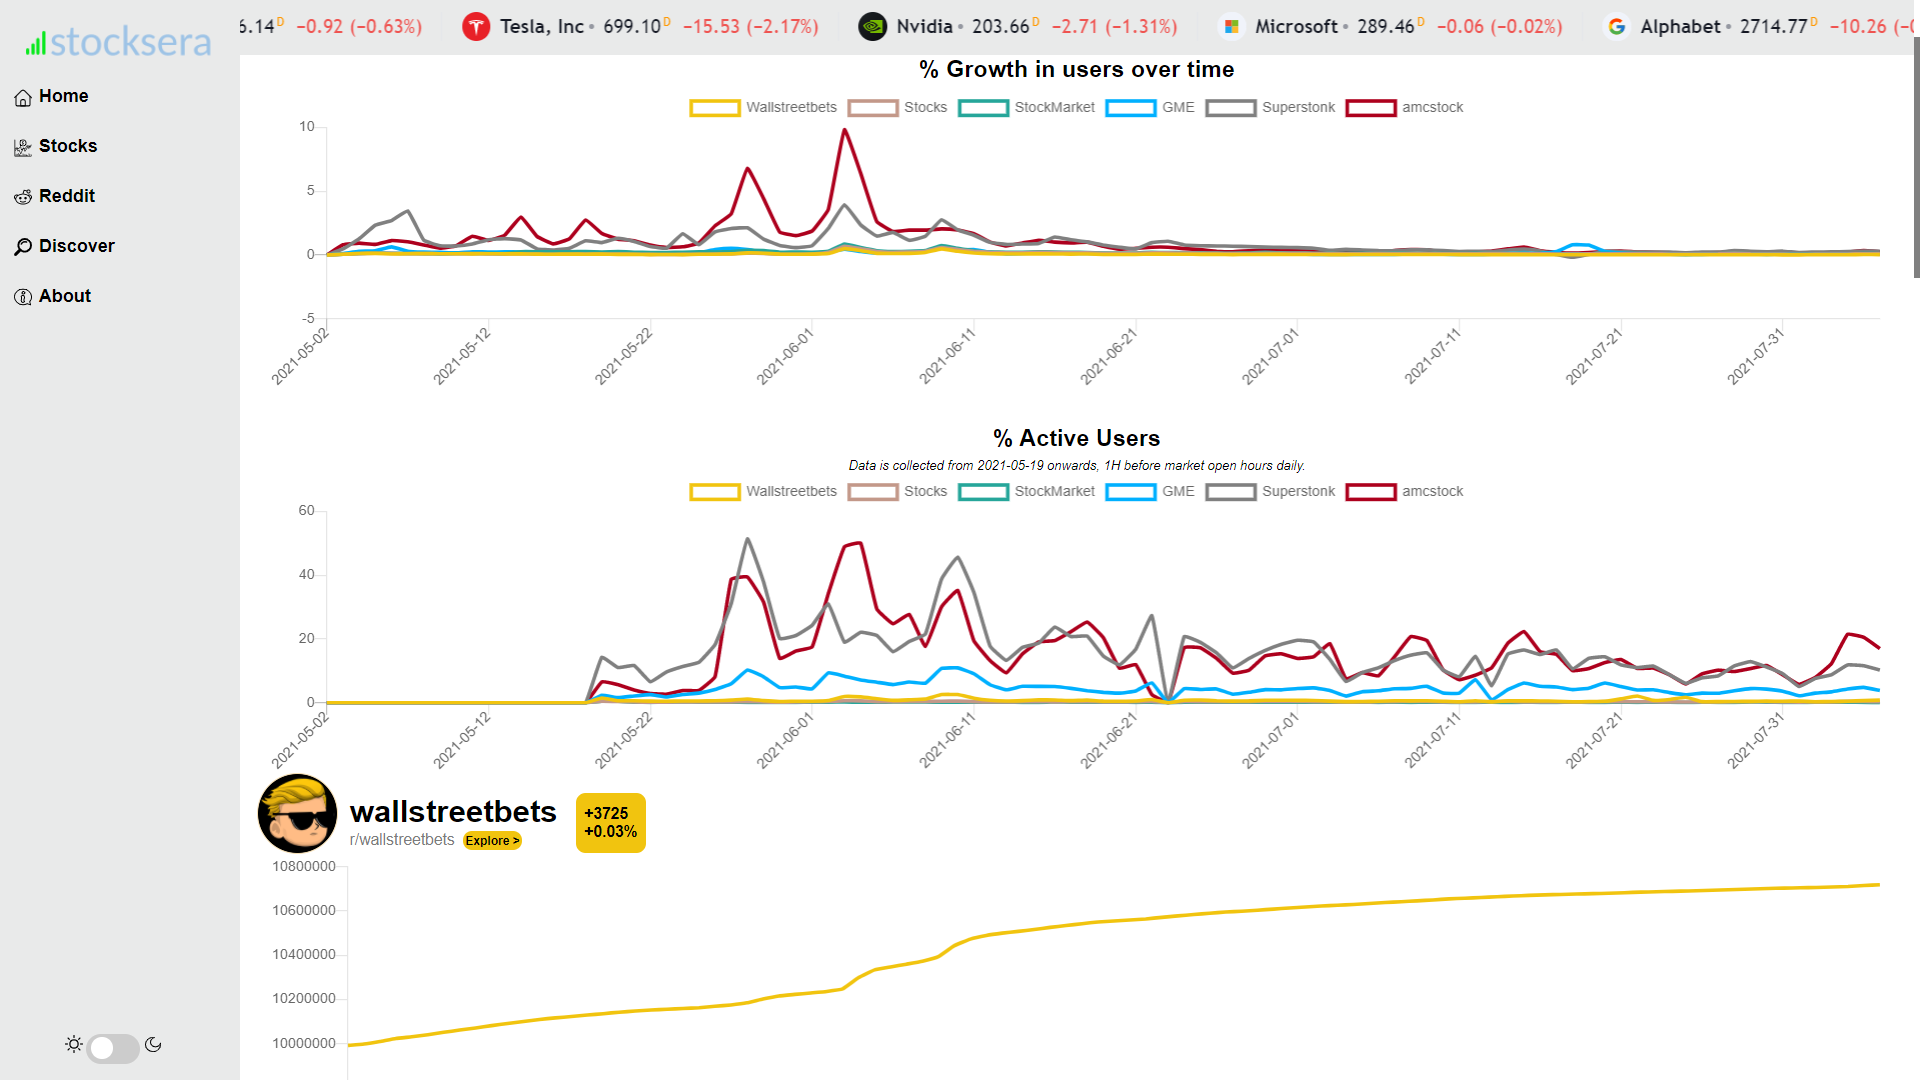
- Look at the increase in number of redditors on popular sub-reddits such as r/wallstreetbets, r/Superstonk and r/amcstock.
- Growth in number of new redditors and percentage of active redditors.
- This page is currently very basic, open to new suggestions on how to improve this page.

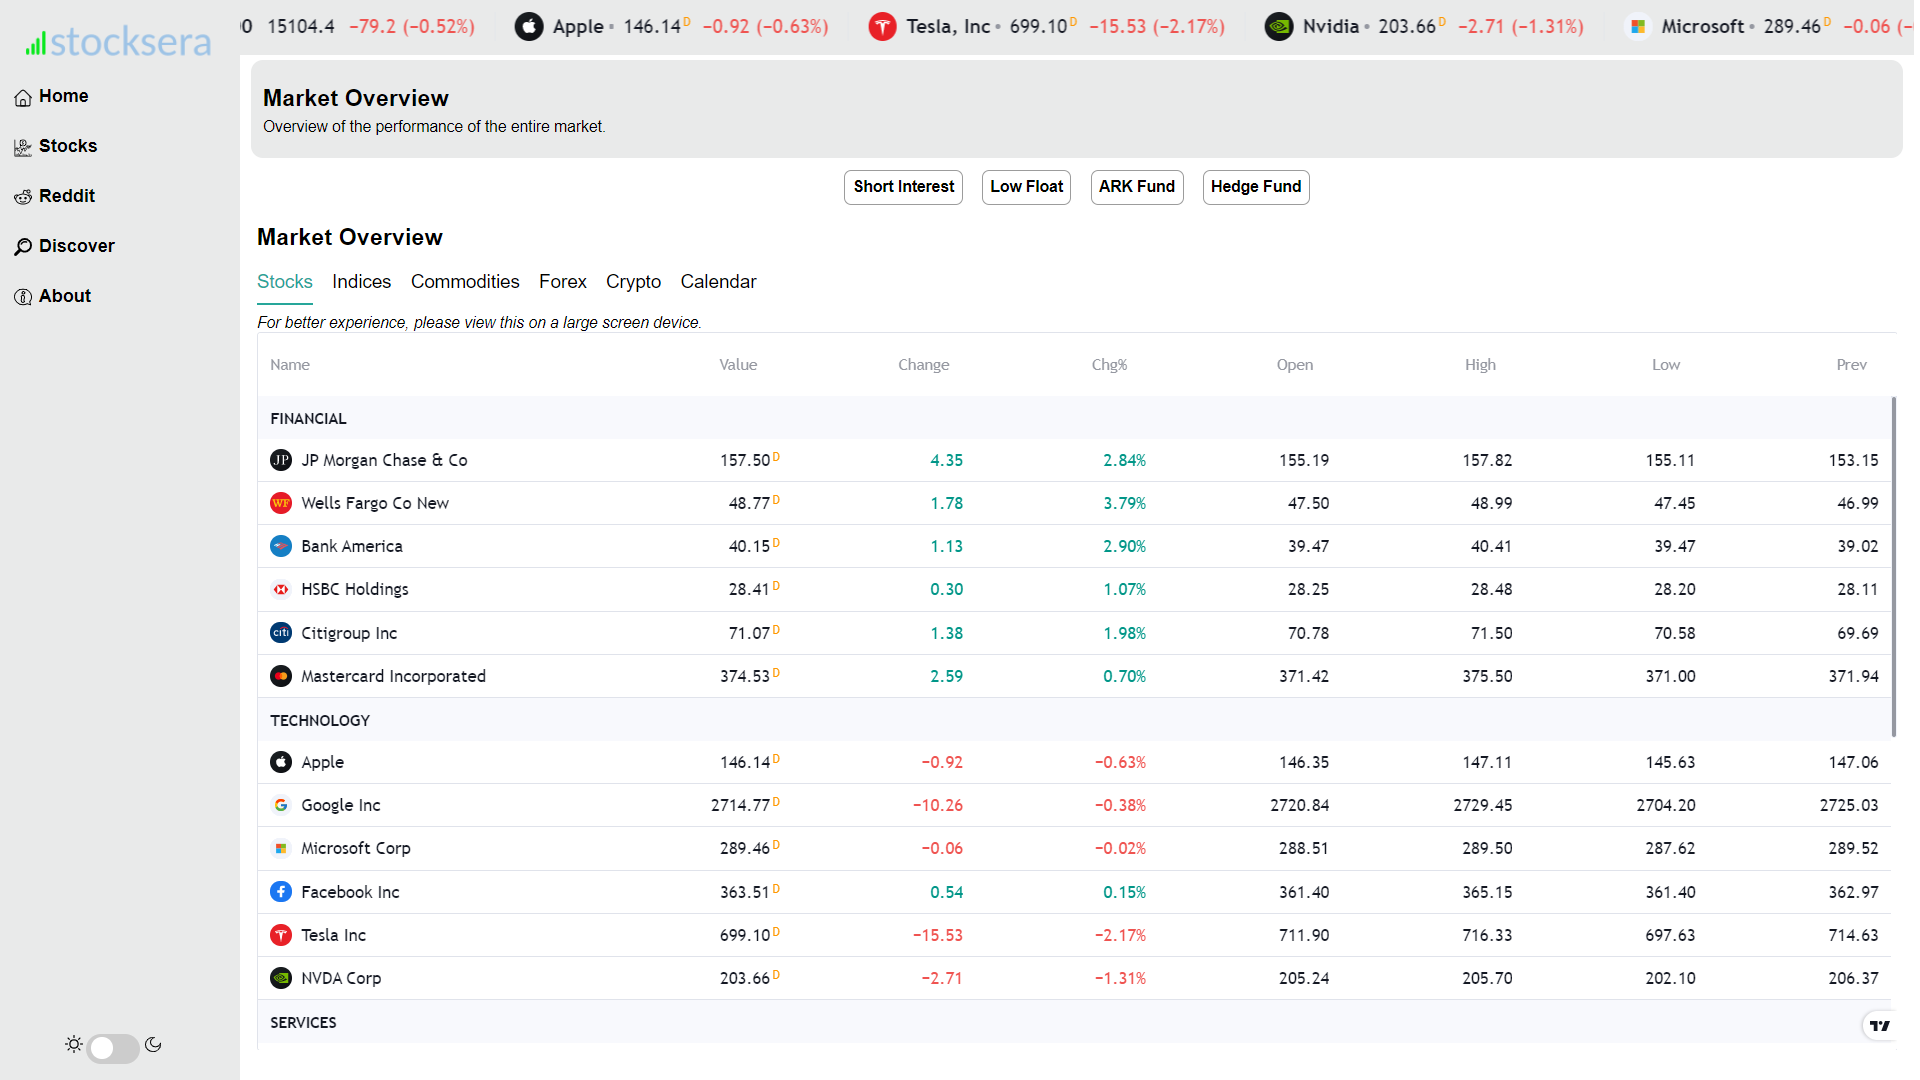
- Overview of the performance of the entire market.
- Data is from Trading View

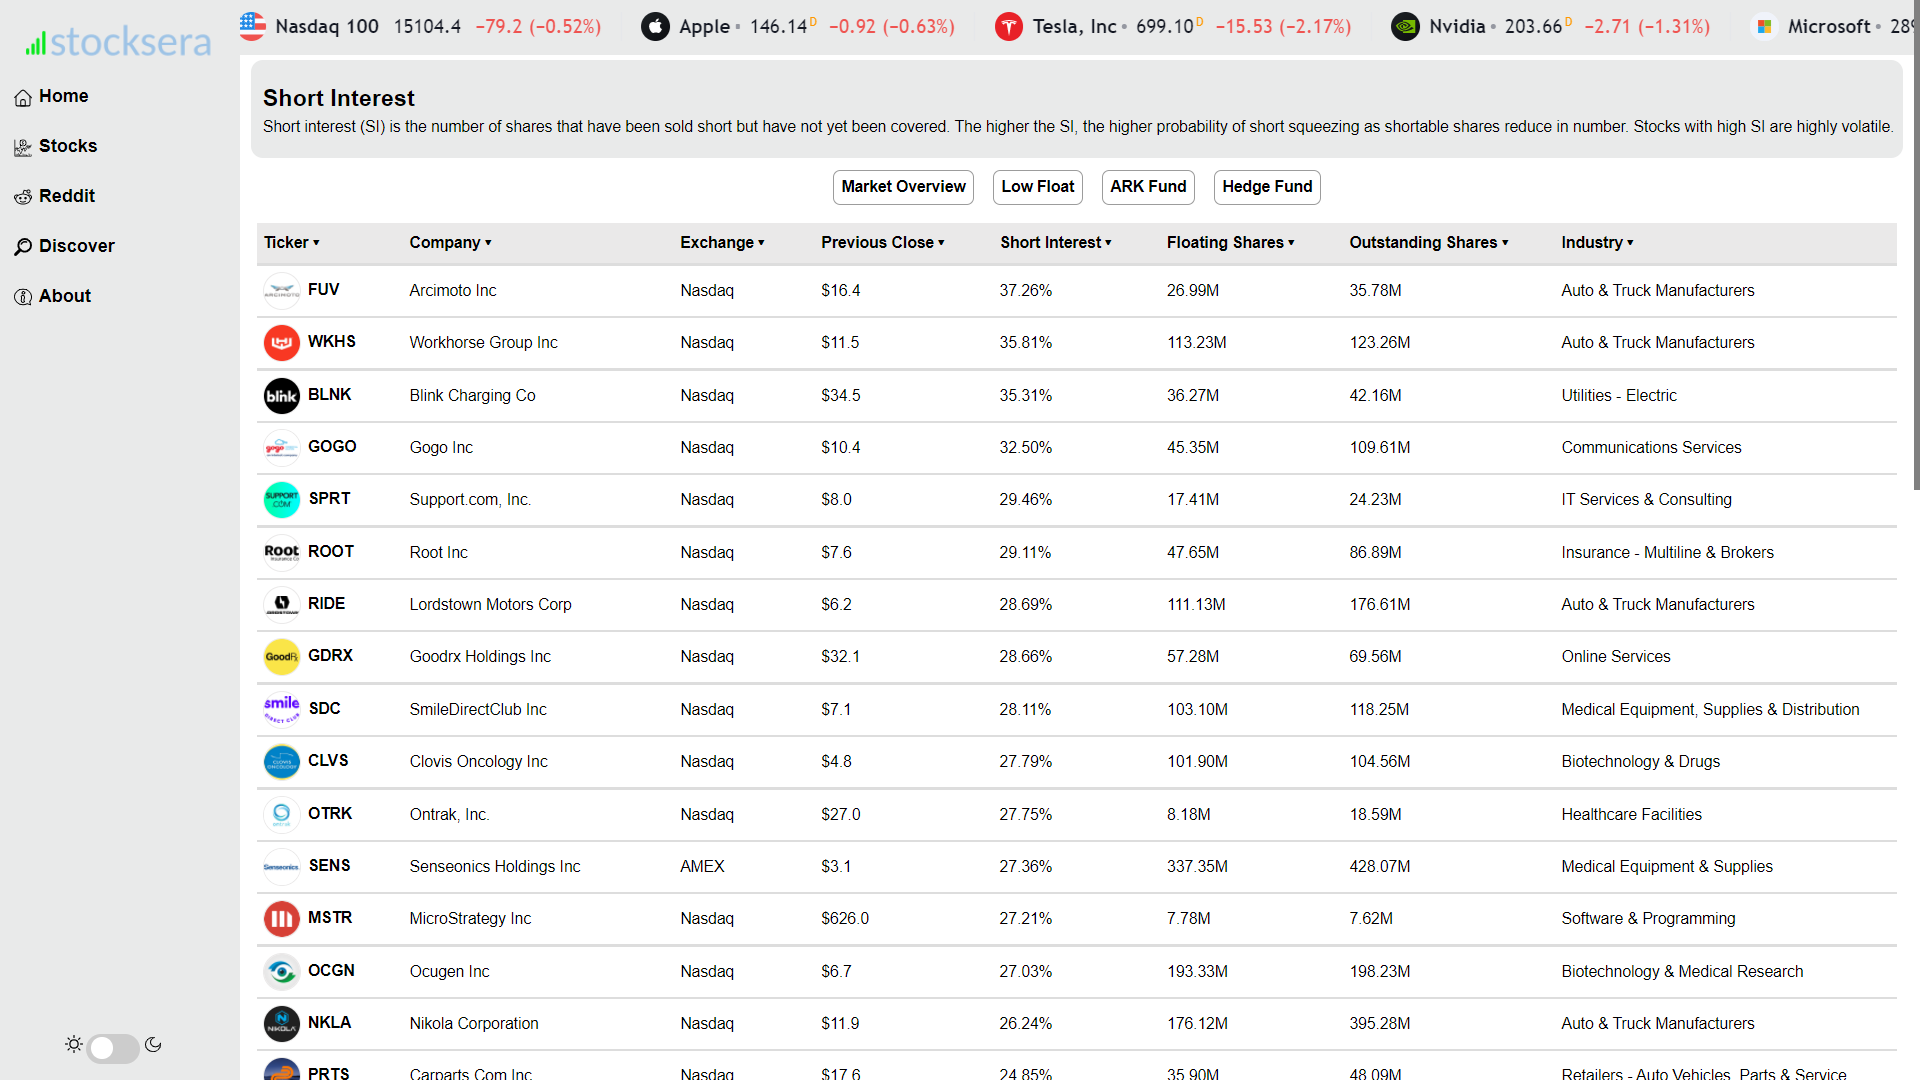
- Identify tickers with the highest short interest level.
- Data is from shortinterest.com

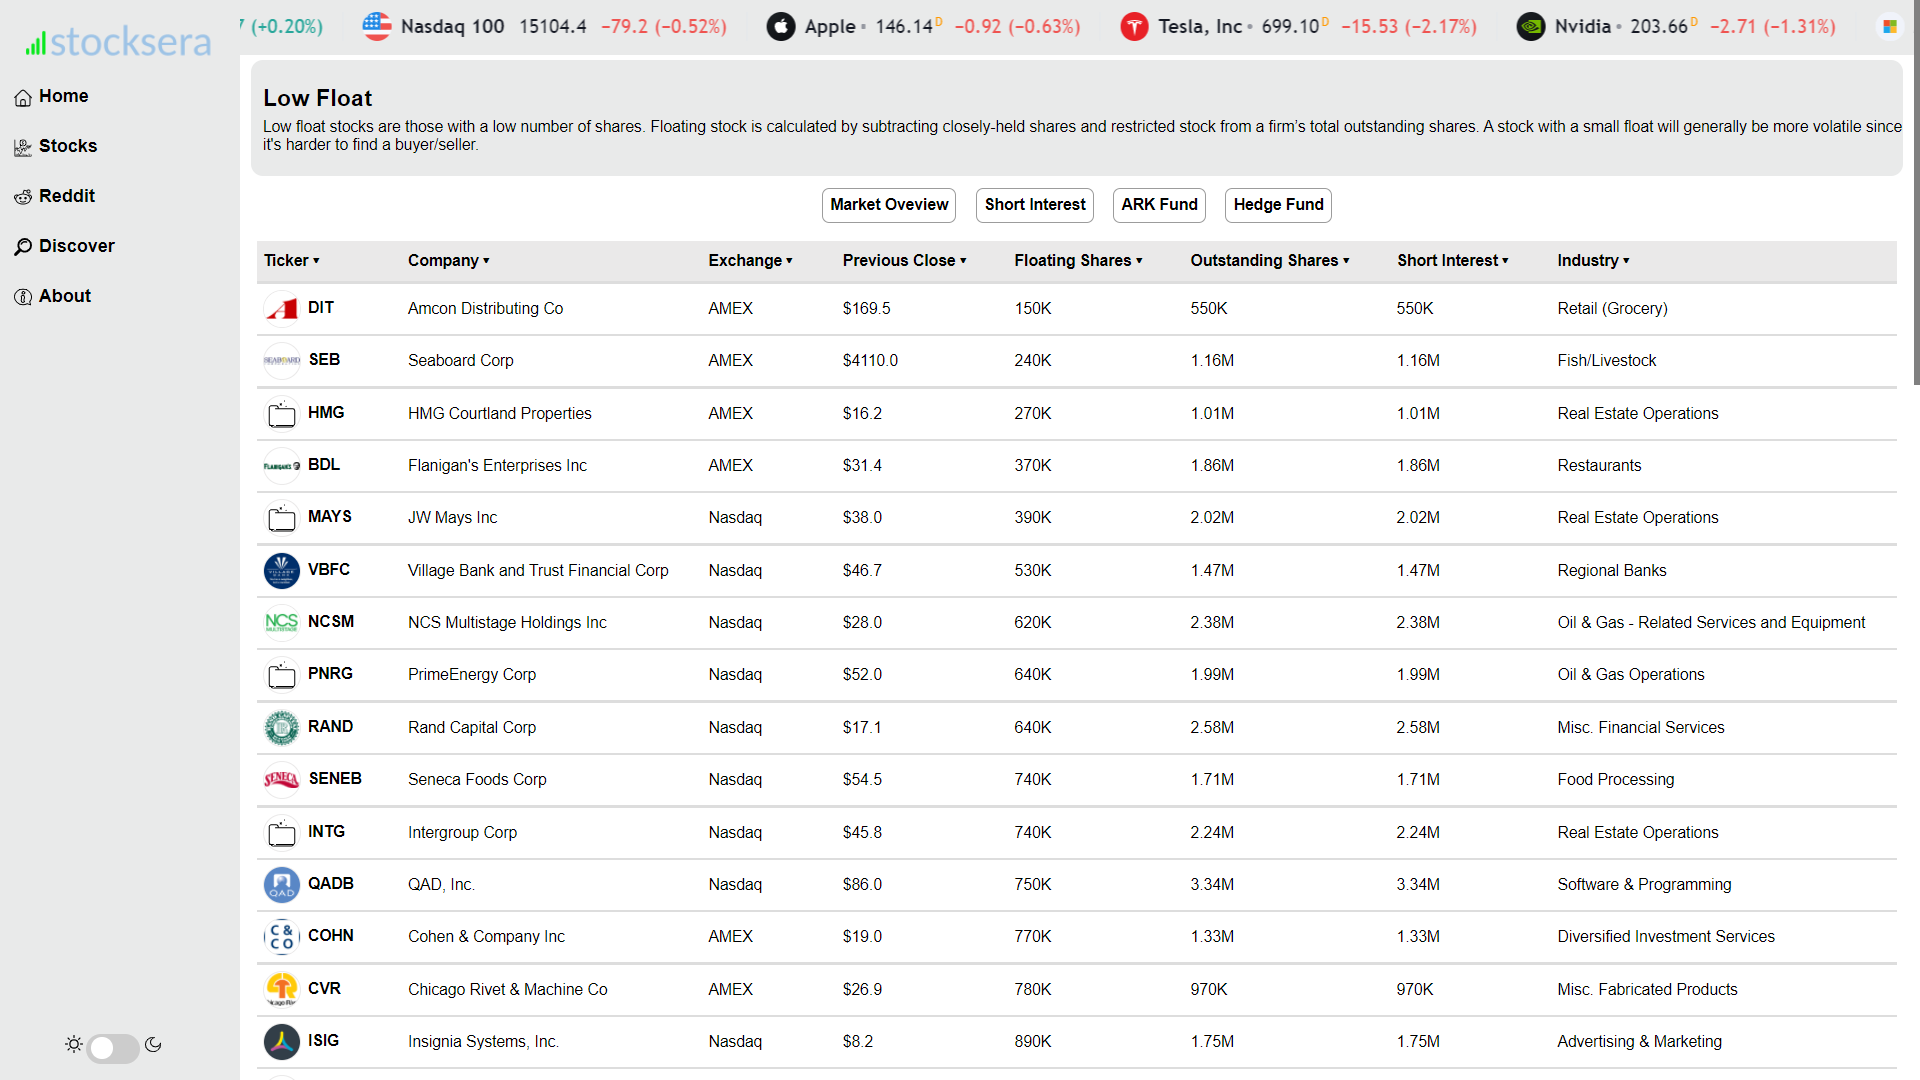
- Identify tickers with low float.
- Data is from lowfloat.com

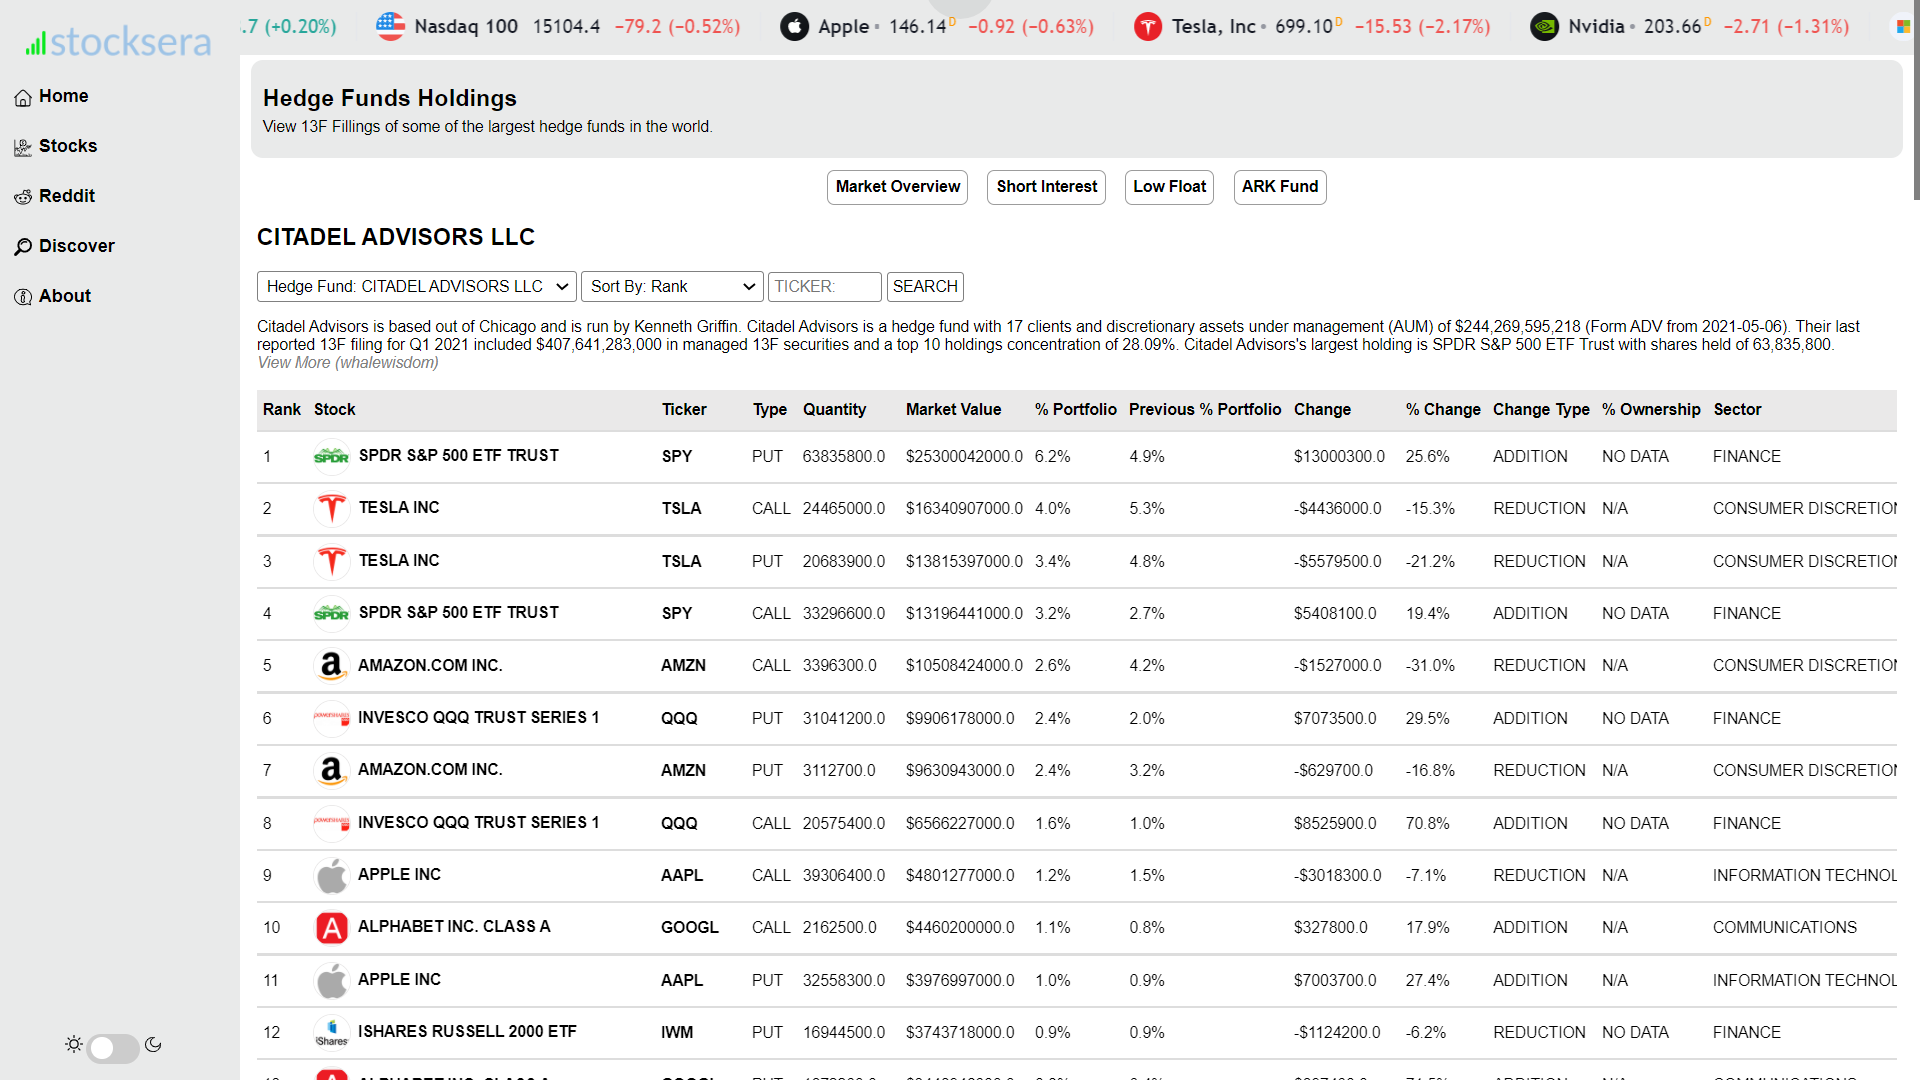
- Identify top holdings from some of the major hedge funds.
- Data is from whalewisdom

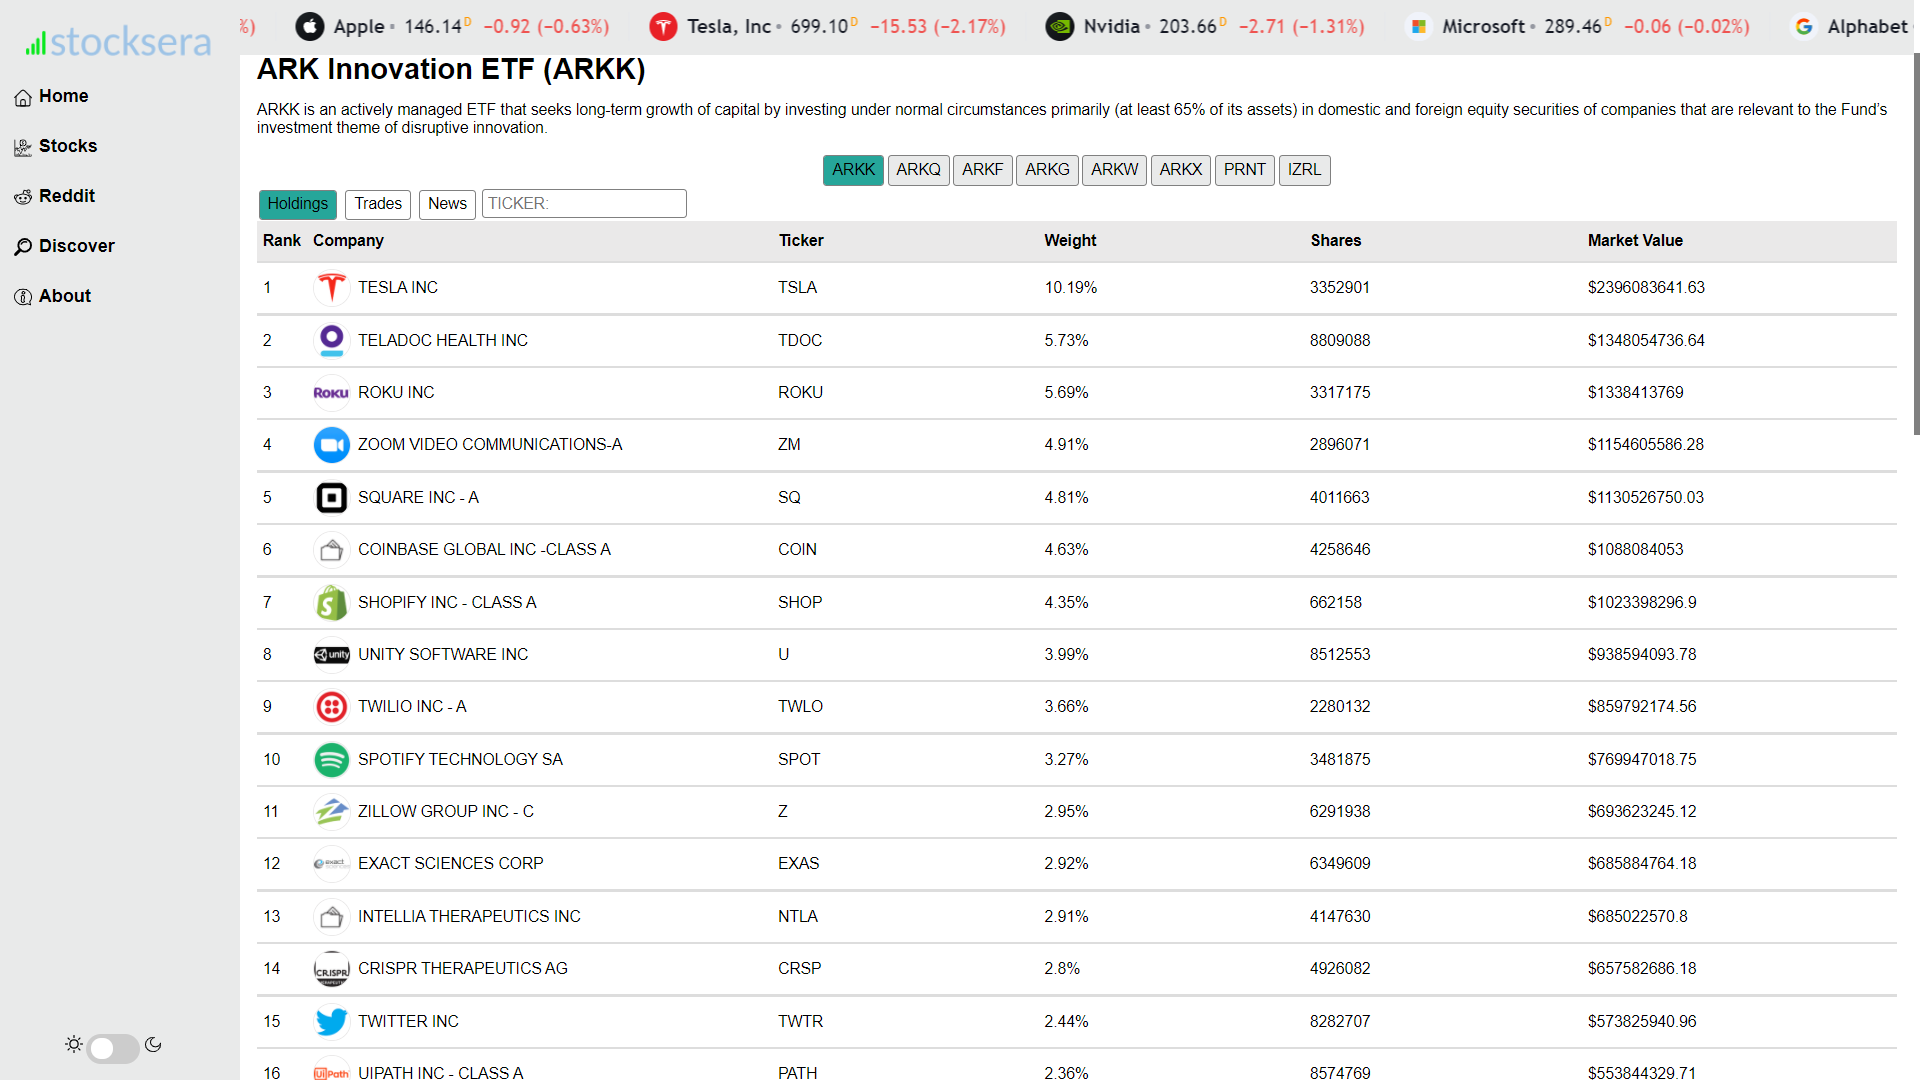
- View holdings, trades and news of all companies in ARK Fund.
- View trades and ownership of a ticker.
- Data is from arkfunds.io/api

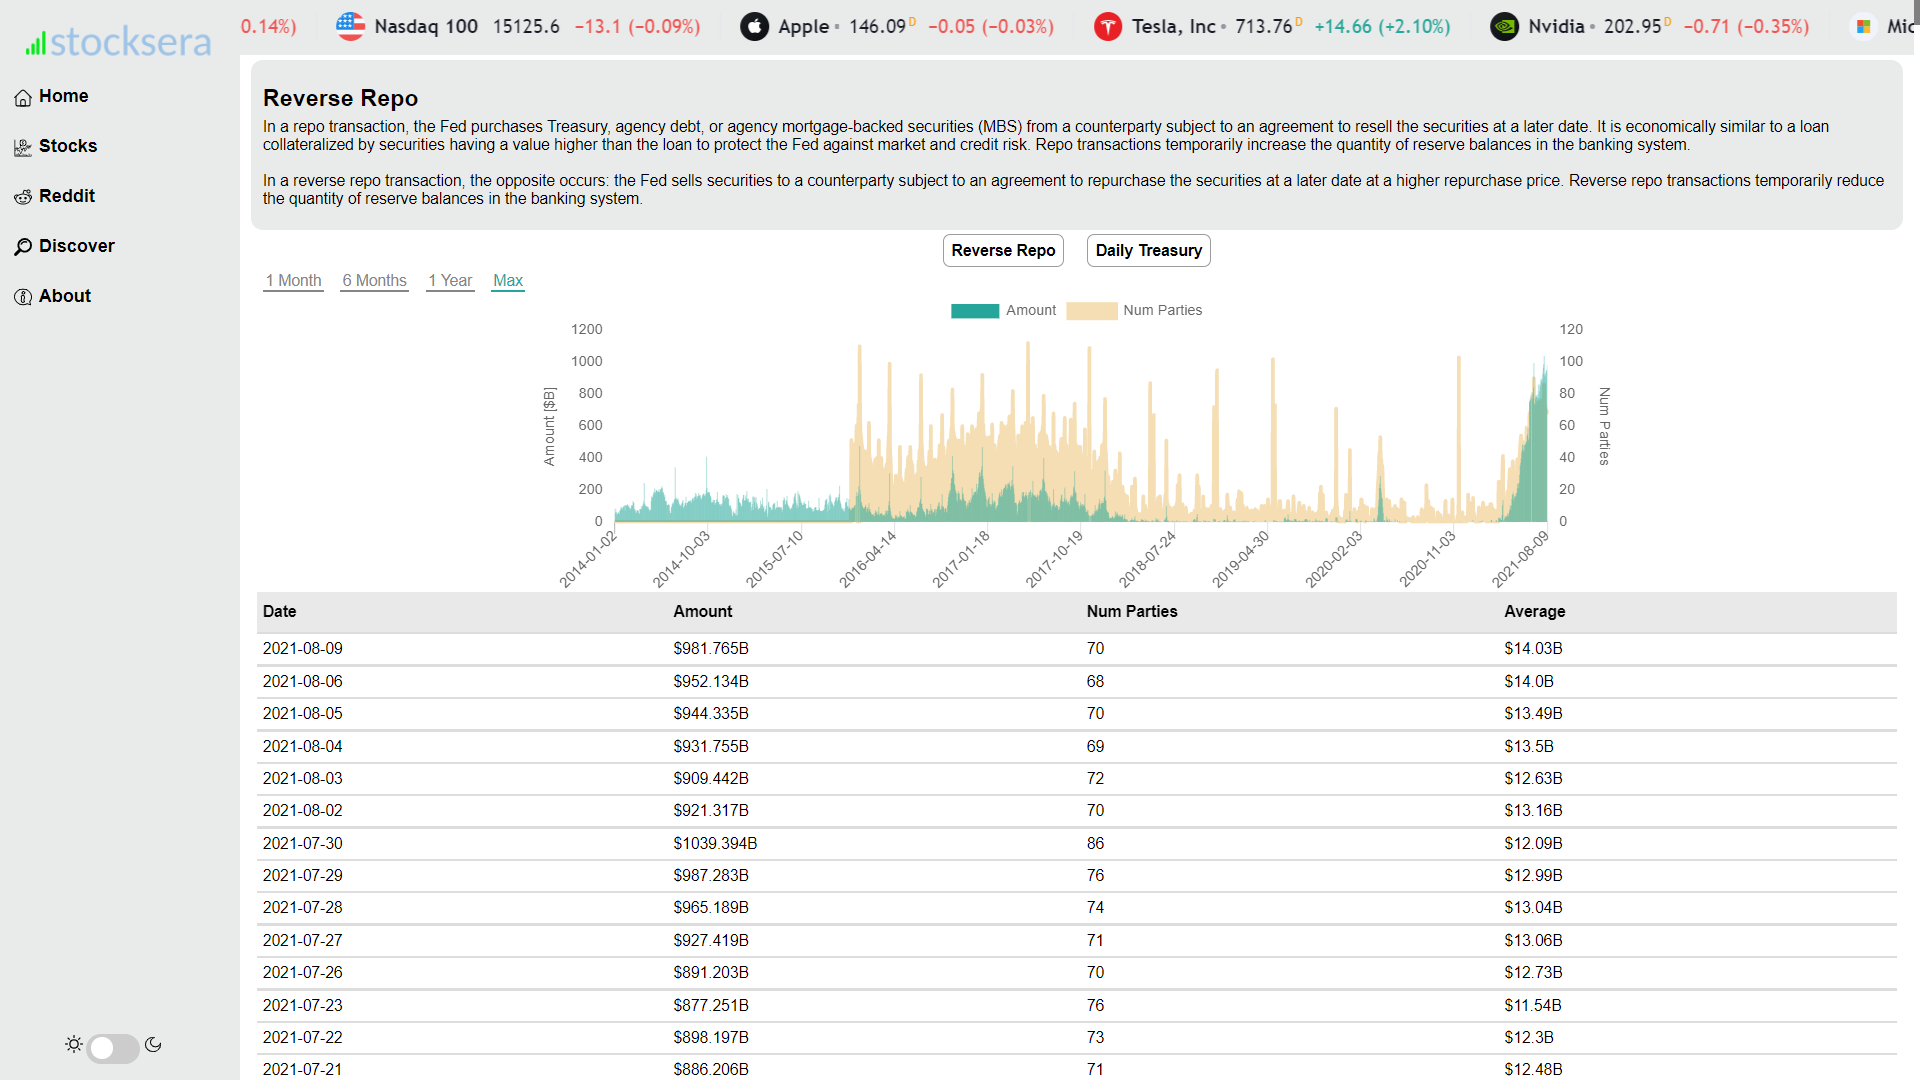
- Daily reverse repo transactions (amount, number of parties, average)
- Data is from newyorkfed

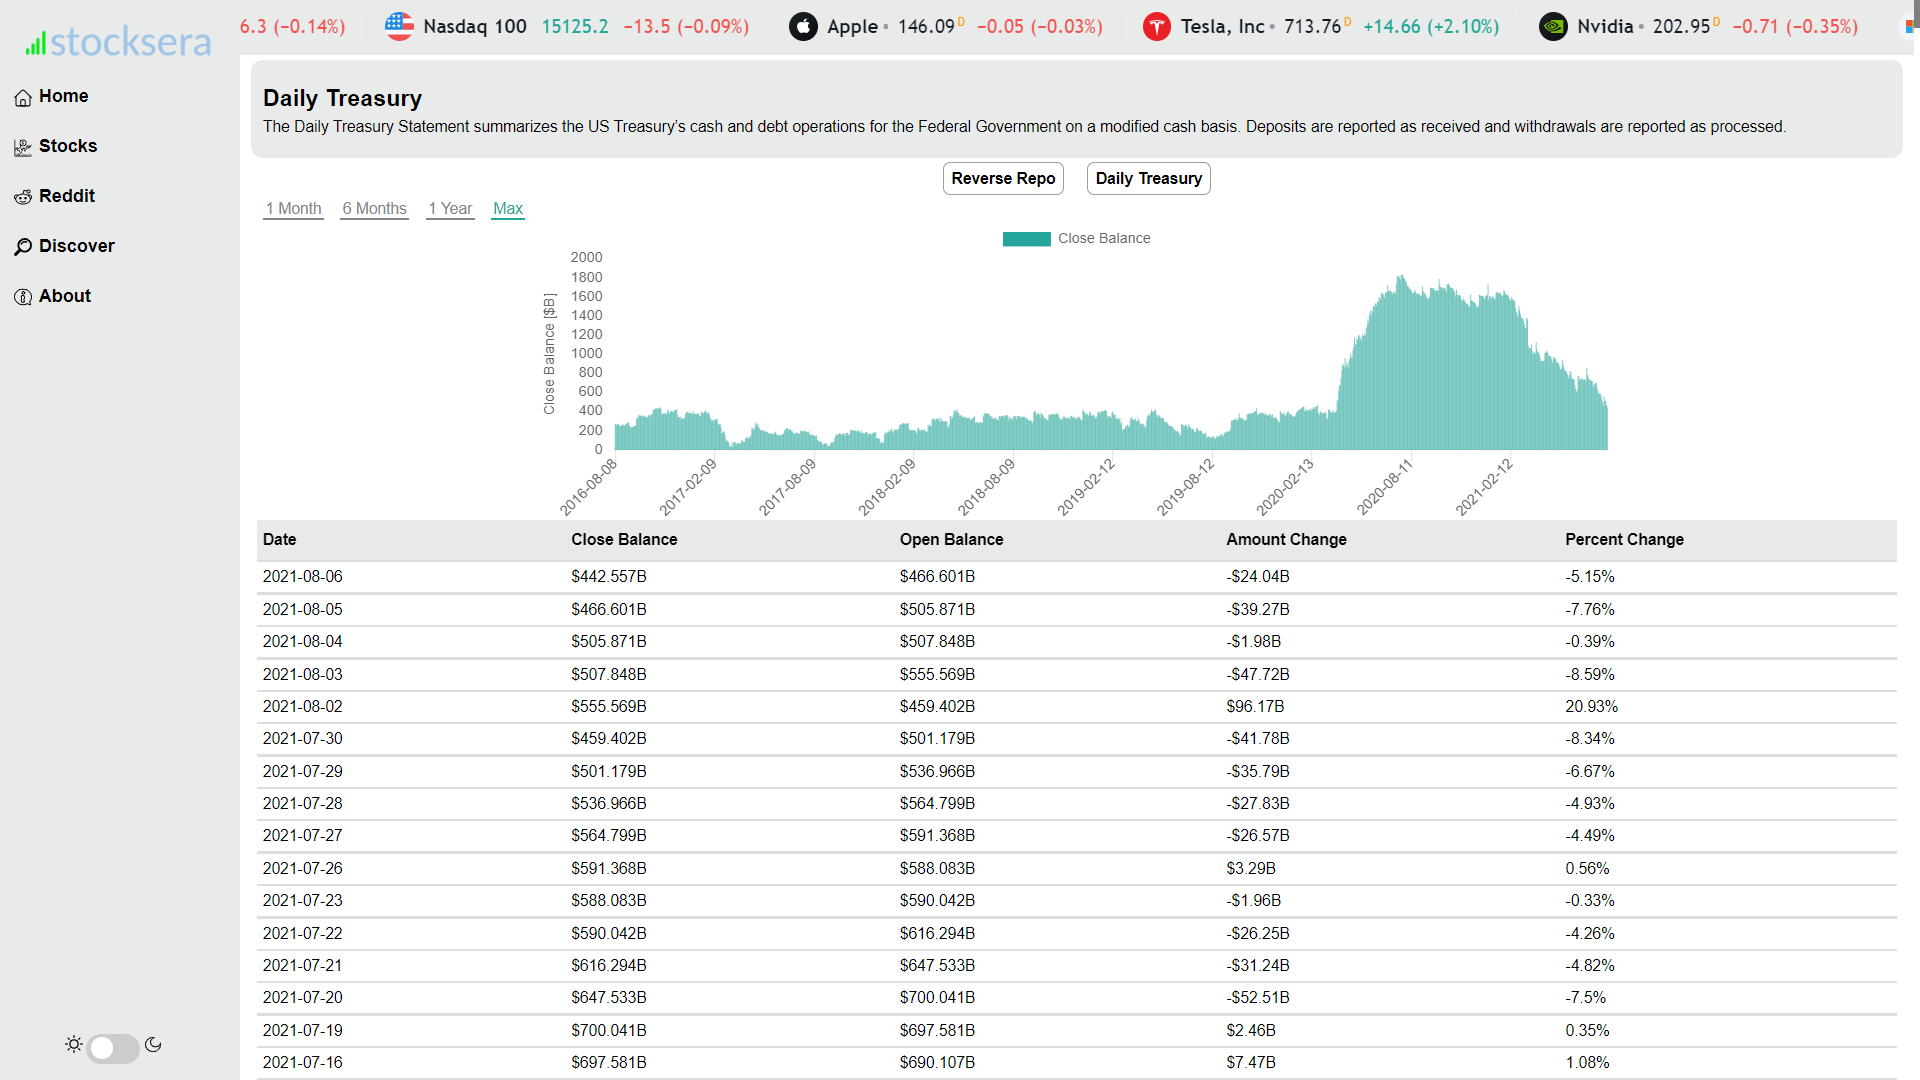
- Daily treasury (closing balance, opening balance)
- Data is from fiscaldata.treasury.gov

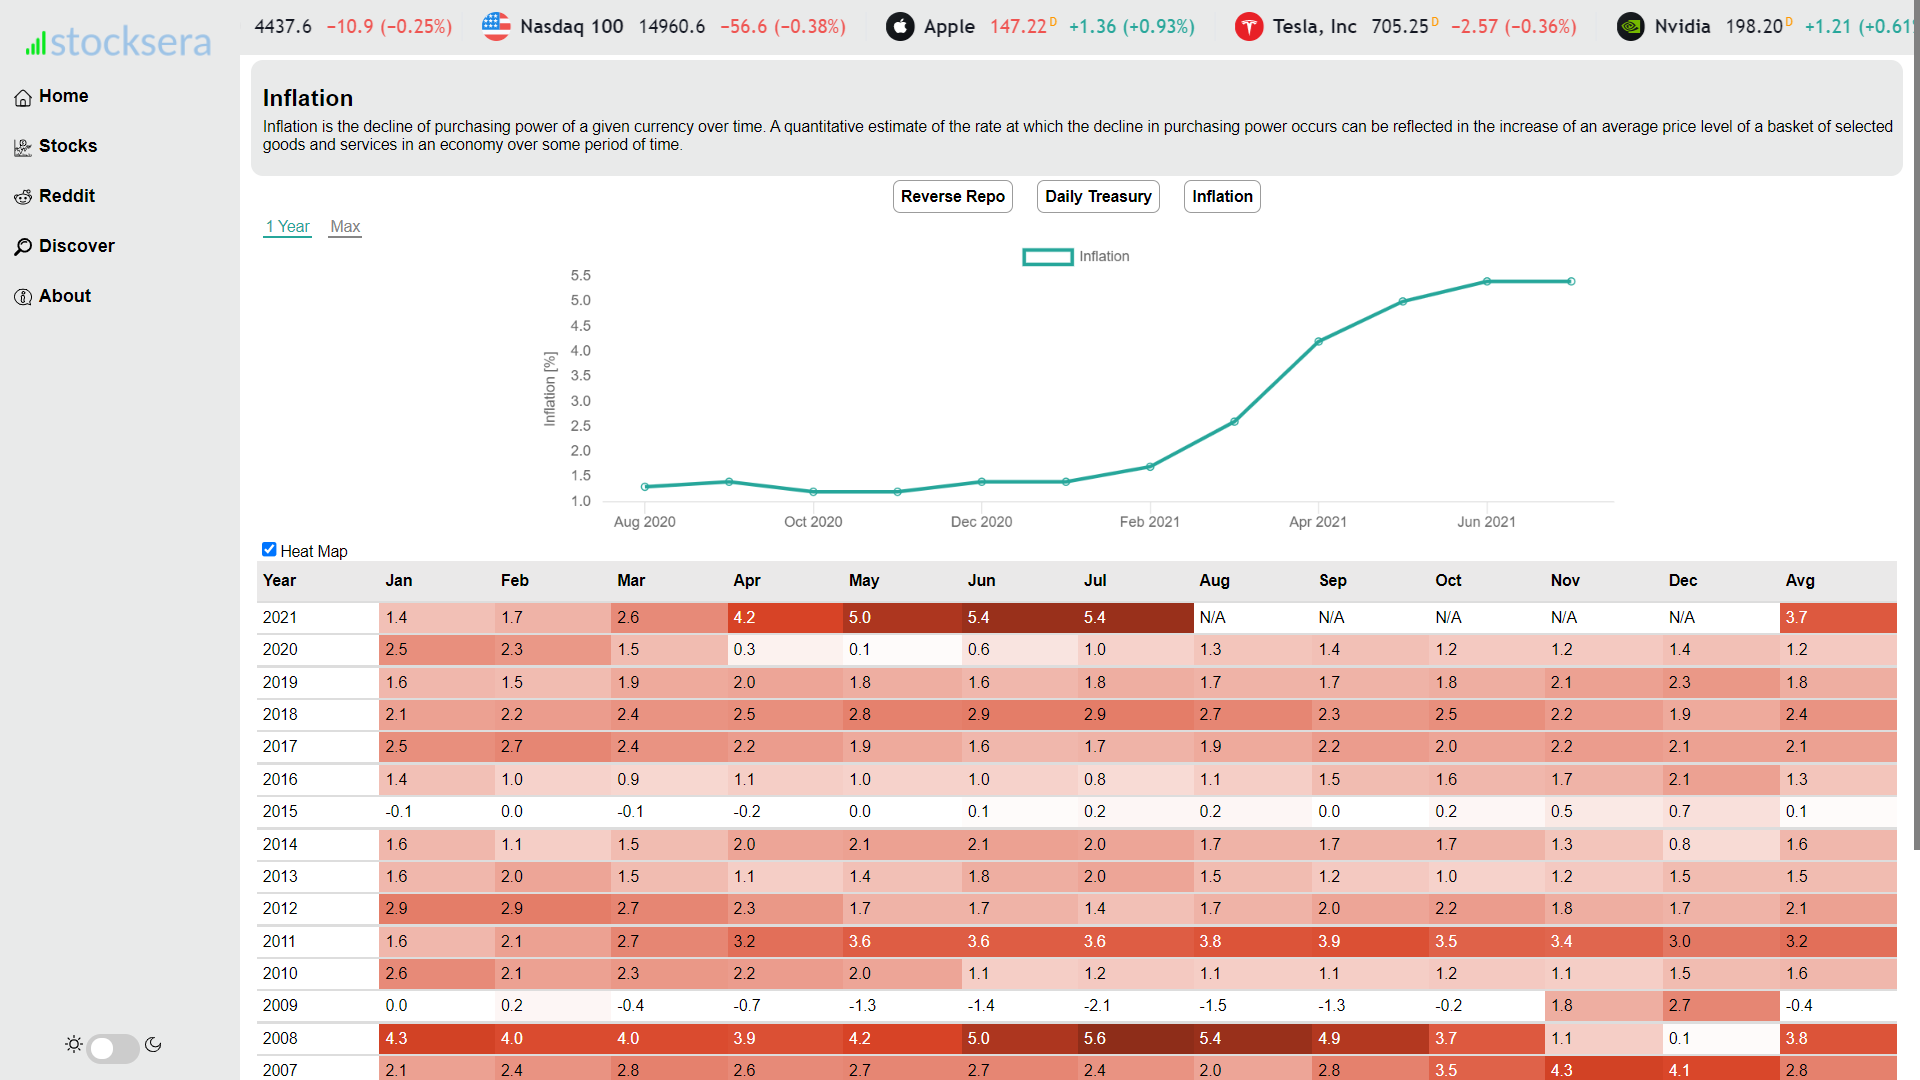
- Monthly inflation rate (with heat map) from 2001
- Data is from usinflationcalculator.com/inflation

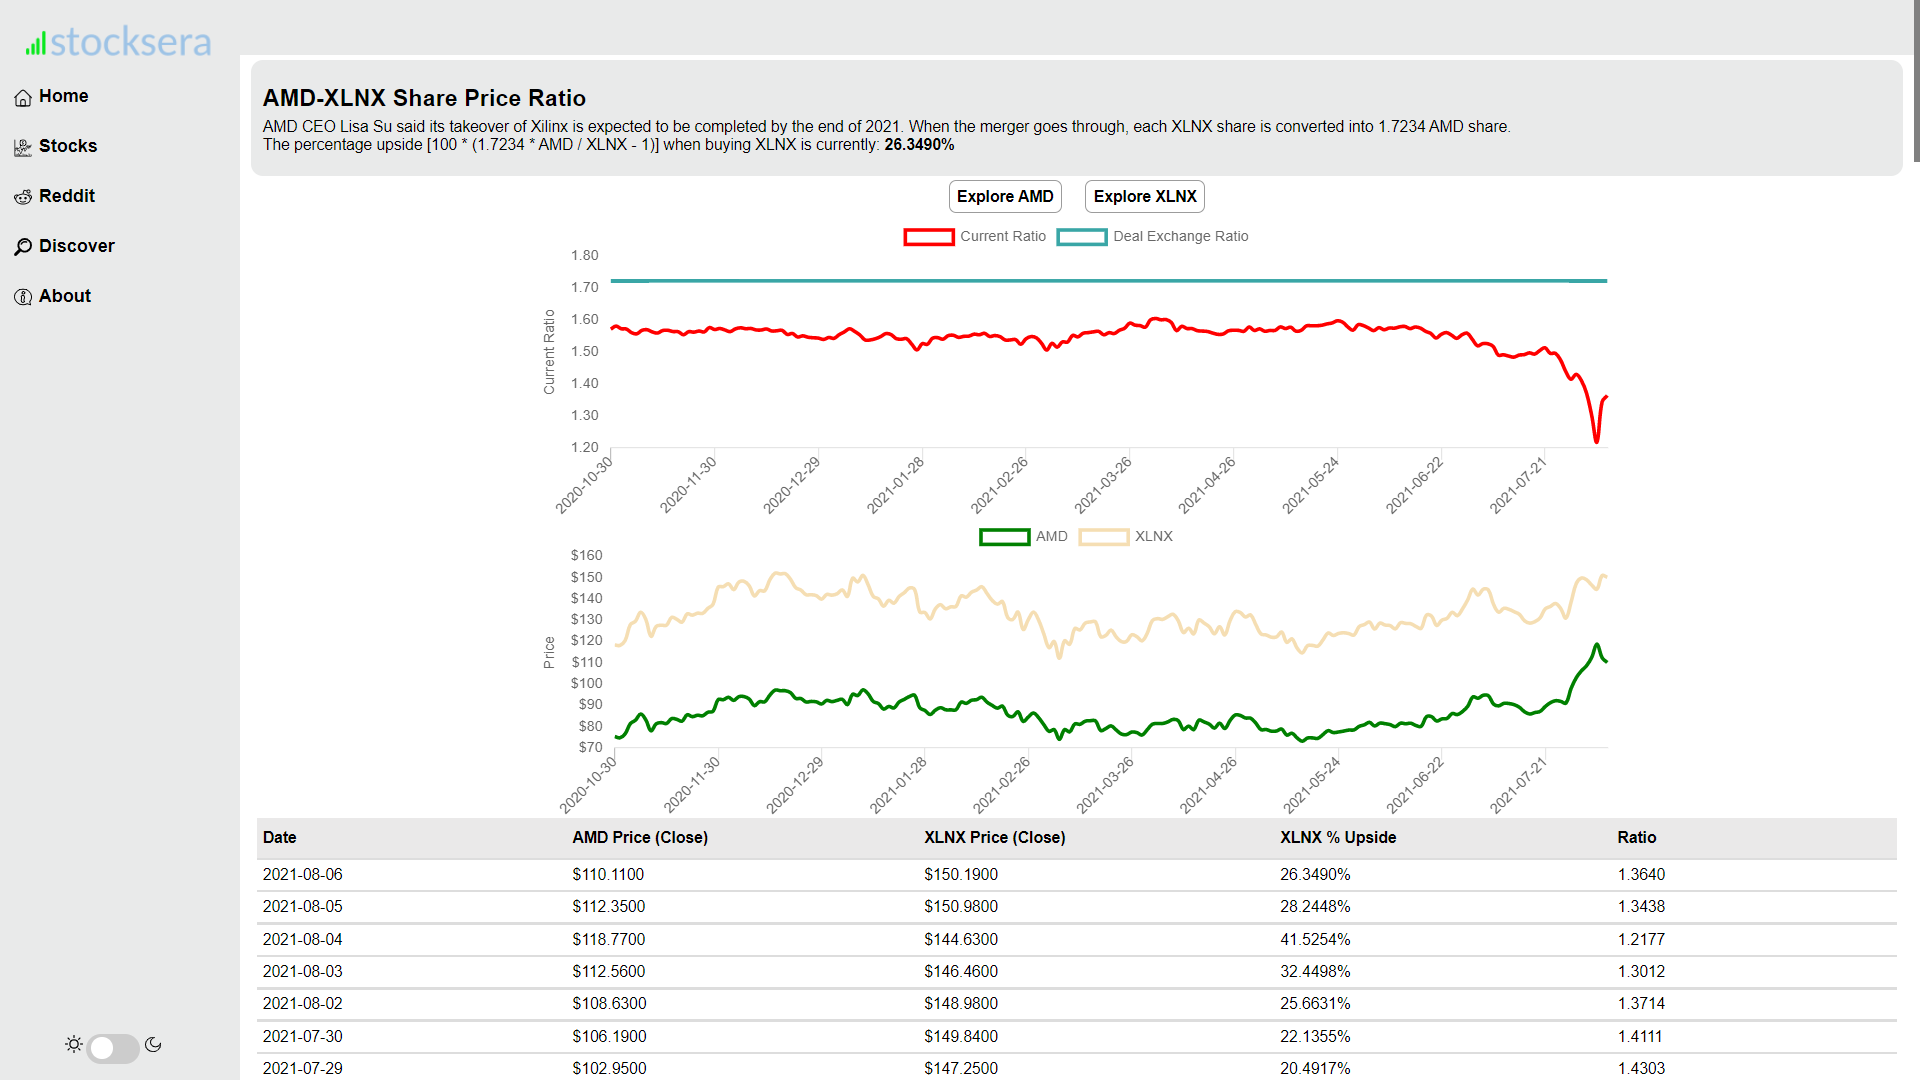
- AMD-XLNX Share Price Ratio.
- Percentage upside when buying XLNX

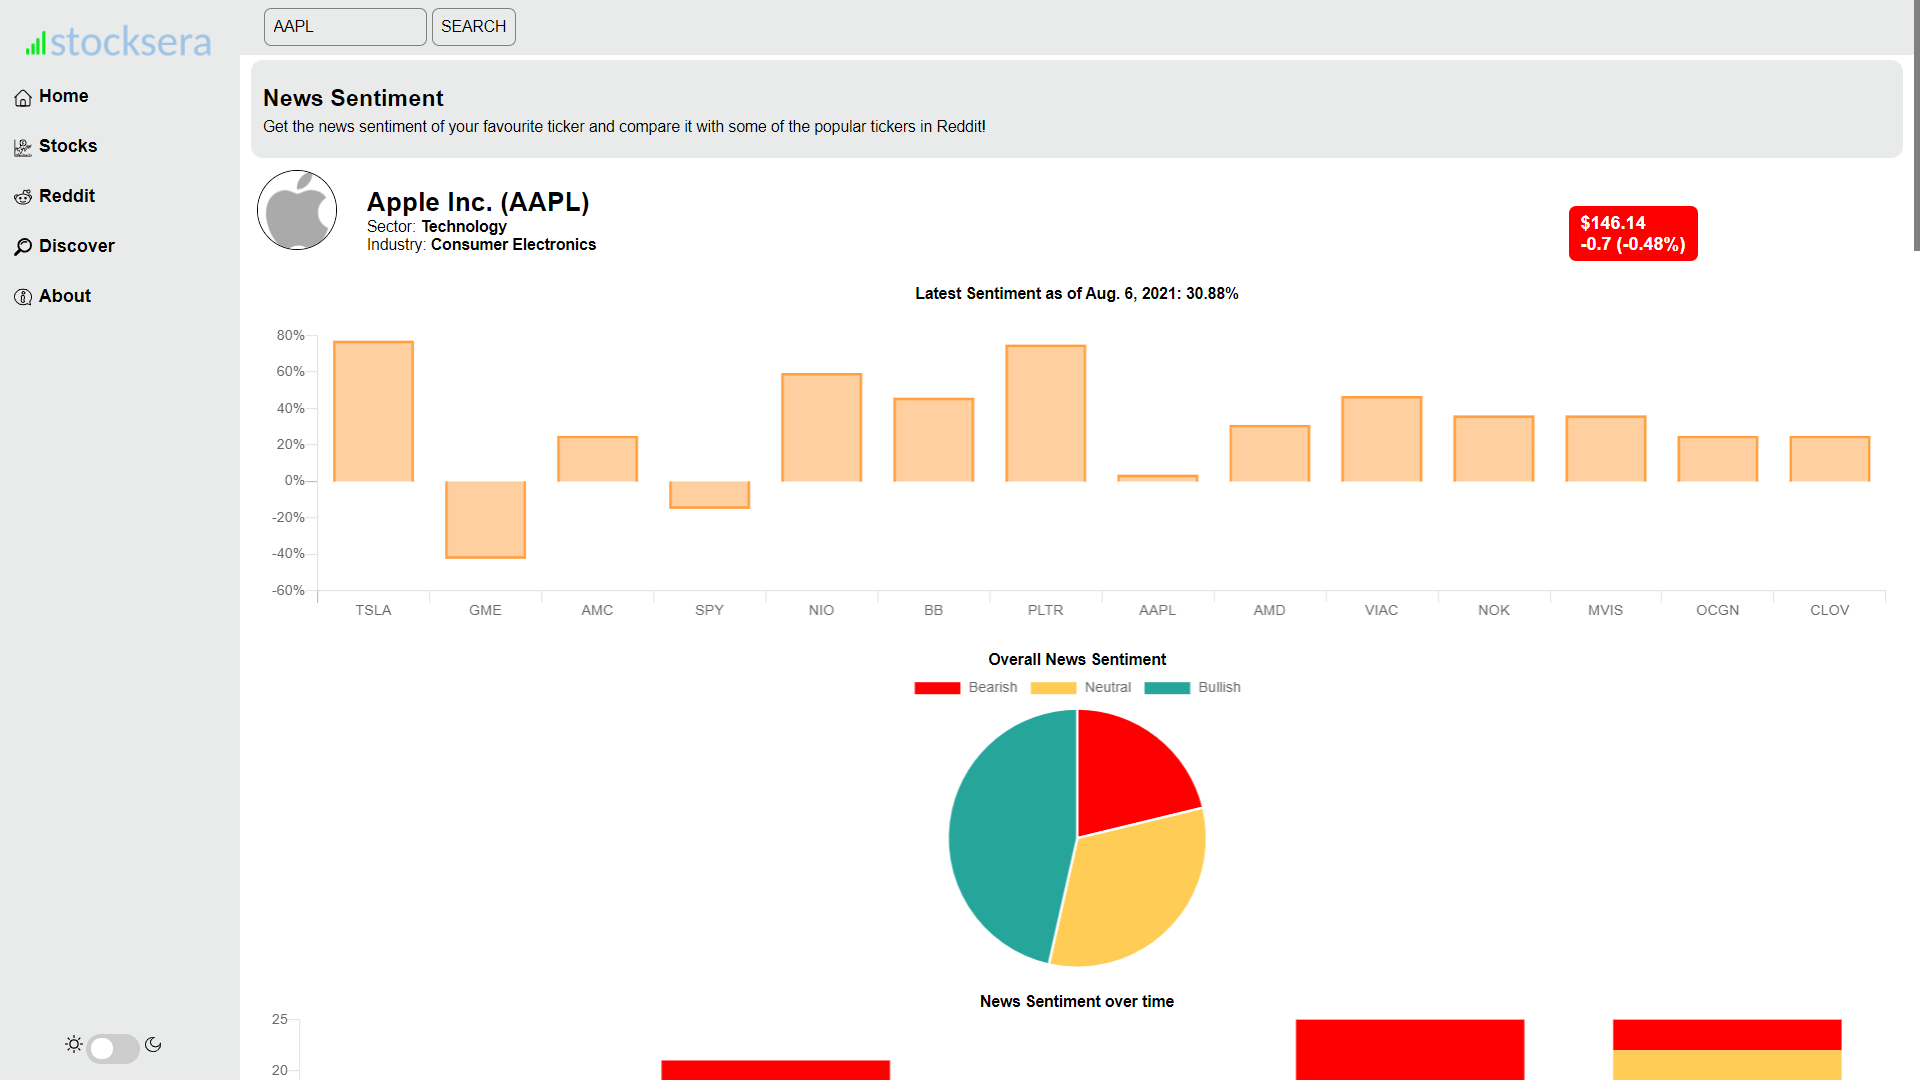
- View latest news of your favorite ticker
- Get their overall news sentiment and their sentiment level over time
- Compare the sentiment level with other popular tickers such as GME, AAPL, TSLA.
- NOTE: This feature is not available on pythonanywhere. To use this feature, you have to host the application locally. Please refer to the Developers section for more details
- Data is from finviz

- Advantages of hosting it locally on your computer:
- Faster rendering time
- Customise your own ticker
- Access to news sentiment
# Clone the project
git clone https://github.com/spartan737/Stocksera.git

# Create environment
py -m venv venv

# Navigate into project's folder and activate venv
cd Stockera/venv/Scripts
activate
cd .. / ..

# Install modules
pip install -r requiresments.txt

# Set up static file
py manage.py collectstatic
Download nltk data for sentiment analysis. Type the following in console:
>>> import nltk
>>> nltk.download("vader_lexicon")
- Register for an API in https://www.reddit.com/prefs/apps and enter credential in scheduled_tasks/config.py
- Compilation of tasks that are needed to be completed.
- Get trending tickers in Reddit, subreddit subscribers statistics, stocks with low float and high short interest.
- Please refer to Scheduled Tasks Guide for more information on how to run scheduled tasks.
- Go to ViewStocks/urls.py and uncomment 'sub_news/' and 'latest_news/'.
- Go to templates/format.html and uncomment line 33.
- Go to templates/ticker_price.html and uncomment line 122-125.
You can run run_app.bat.
Alternatively, you can run using your terminal:
cd venv/Scripts
activate
cd ../..
py manange.py runserver
You can view the application in 127.0.0.1:8000 and you are ready to explore!
- Show hedge funds (Citadel, Melvin Capital etc) major holdings
- Show T-35 date in FTD data
- Sort hedge funds holdings
- Add 30 days graph for trending reddit tickers
- Show ranking of tickers in reddit and compare it with its price
- Improve speed of website (although I feel that the major issue lies with pythonanywhere-the website I'm hosting instead, since it runs smoothly locally)
- Solved by caching tickers' information when market is closed and caching financial data
- Add trending symbols on r/cryptocurrency
- Income Statement and Cash Flow for Financial data
- Show theta, delta, gamma in Options data
- Show performance of Reddit ETF vs SPY
This project is under the MIT license.