This repository contains Elastic accelerators to provide better and faster insights on top of OutSystems monitoring data.
These accelerators are:
- Elasticsearch definitons
- Help to set up indices and their lifecycle policies.
- See it at data_storing-elasticsearch
- Logstash pipelines
- Simplify the ETL of monitoring data from the OutSystems platform.
- Enrich data to allow building more human-readable visualizations.
-
- See it at data_storing-elasticsearch
- Kibana dashboards
- Provide an out-of-the-box set of visualizations that help understand OutSystems applications and platform health, based on their performance and errors.
- Reduce time to insights (based on OutSystems monitoring data).
- Improve troubleshooting capabilities.
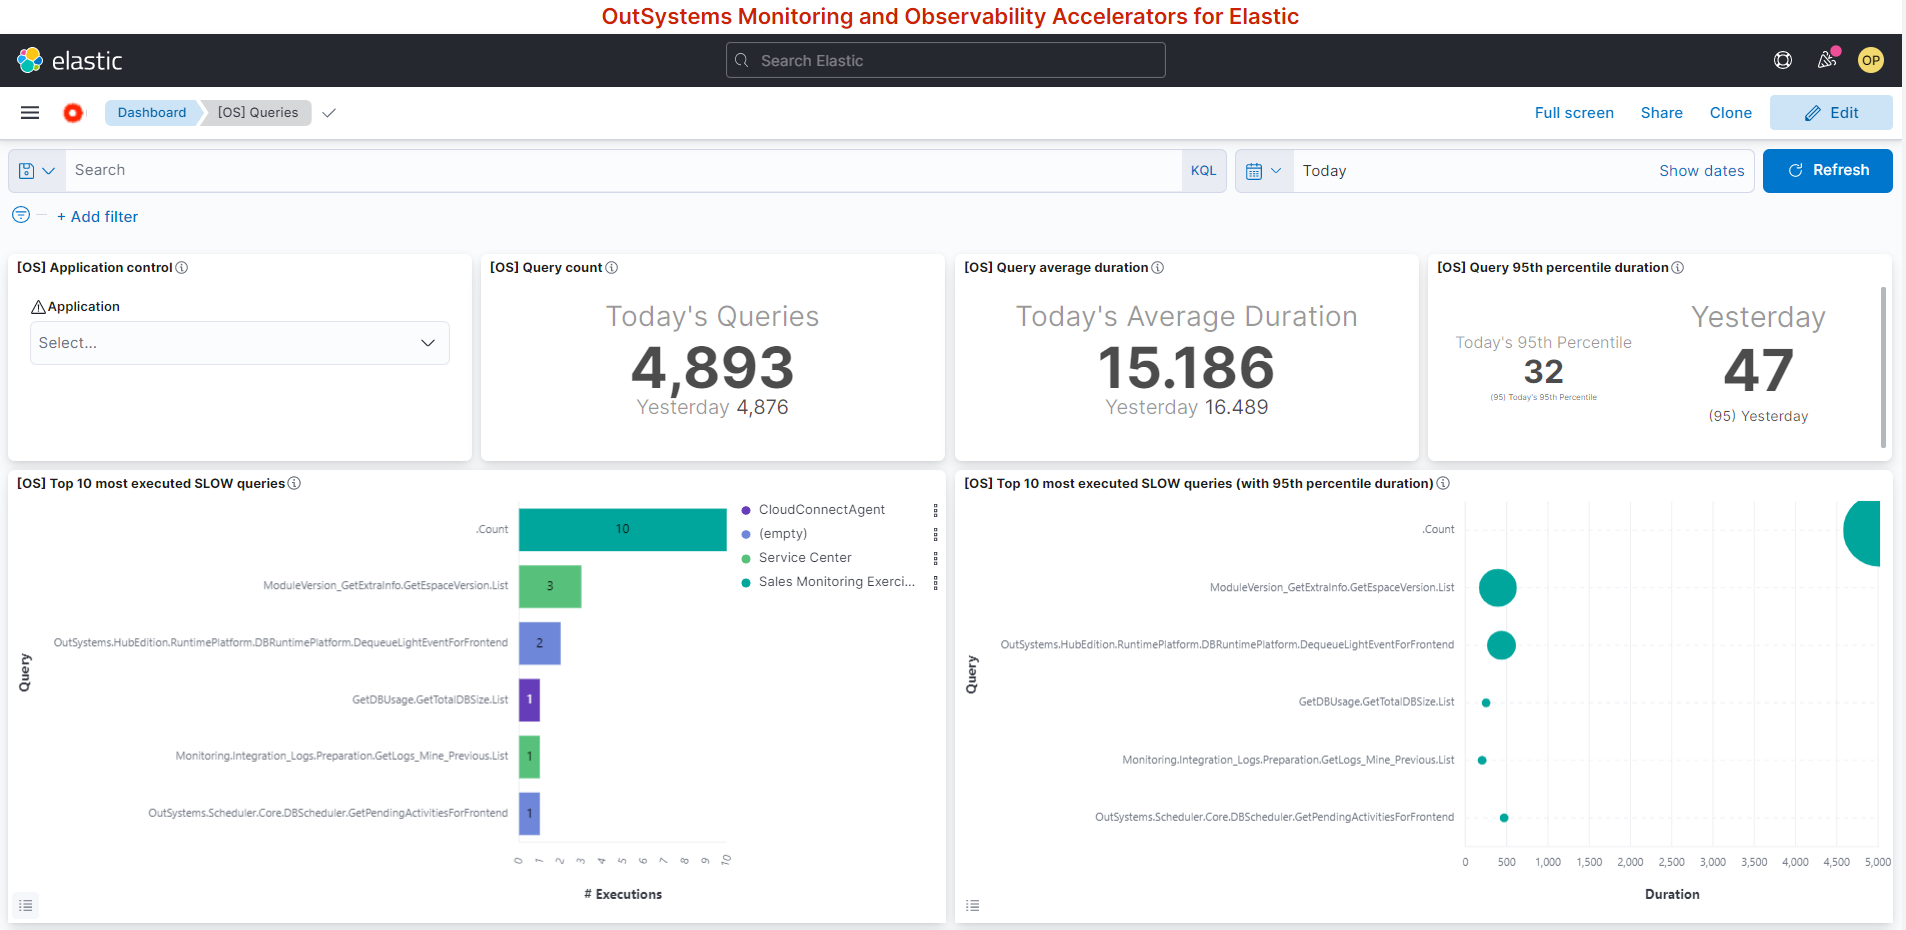
Example of one of the visualizations available on this repository:

❗ To know how to set up and use this repository artifacts you can go directly to the this section How to use the contents of this repository
❗ Want to support to implement or extend this assets? Contact OutSystems Professional Services. You can know more about us at: https://www.outsystems.com/success-services/professional-services/
The major goal of these accelerators is to provide OutSystems customers with an out-of-the-box solution to:
- Easily observe the OutSystems monitoring data on Elastic with more advanced visualizations, compared to the ones from the built-in tools of the OutSystems platform.
- Easily search through OutSystems monitoring data, in particular through the OutSystems logs with:
- Free text search.
- Selection of visible information.
- Do more advanced monitoring, compared to what can be done using the built-in tools of the OutSystems platform. Things like:
- Build alerts for an OutSystems environment or OutSystems Factory.
- Leverage Elastic analytic capabilities to have deeper insights on performance and behavior of applications, and the platform itself.
- Observe OutSystems applications performance and errors through time.
- Quickly pinpoint performance bottlenecks, areas to improve, etc.
- Figure out what is affecting performance:
- Slow Queries
- Slow Integrations
- Slow Extensions
- Provide an example of how to set up and monitor SLOs.
- Fast and efficient set up of advanced monitoring and observability solution with a free version. But also with support from Elastic and/or OutSystems Professional Services
- Fast detection of performance and availability issues (of potential or existing)
- Lower troubleshooting times
- Increase the insights to continuously improve your applications and factory through a data drive approach.
Here are some examples of OutSystems metrics that can be monitored using these accelerators:
- Request Time Duration (for each request):
- Client Time (load time)
- Server Time, which can be decomposed into:
- SAT (Session Acquisition Time)
- Query Execution Time
- Integration Execution Time
- Extension Execution Time
- Server side performance metrics
- Session size
- Viewstate size
- Number of slow queries
- Number of slow integrations
- Number of slow extensions
- Errors metrics
- Number of errors
- Number of errors by type
These metrics are the ones that OutSystems Professional Services Experts teams consider to be a starting point to understand applications and platform performance.
As stated, these are just examples of some metrics that can be monitored, based on the platform data.
If you have low to no experience with the Elastic stack, you can refer to:
If you are good with setting up the Elastic stack, and you want to know how to use these accelerators, check the following documents (with the following order):
- How to use the Elasticsearch accelerators.
- How to use the Logstash accelerators.
- How to use the Kibana accelerators.
If you want to explore more deeply what you can take out of the OutSystems monitoring data, you can refer to:
- How to access OutSystems monitoring data to begin with.
- Understand OutSystems monitoring data.
- Baseline metrics that OutSystems recommends to use
- Some of these metrics are built on top of OutSystems monitoring data (logs, request events, etc)
OutSystems Customer Success DevOps team maintains this repository and is deeply interested in your contribution!
- Reach us through:
- OutSystems Community
- Open an issue
- Make a contribution directly here on GitHub
- Learn how.
OutSystems makes the contents of this repository available under the Apache License with no support, and following the same logic specified on this notice.
See the change log to learn about the latest changes and improvements to this repository.