A tool to extract meaningful health information from large accelerometer datasets. The software generates time-series and summary metrics useful for answering key questions such as how much time is spent in sleep, sedentary behaviour, or doing physical activity.
Minimum requirements: Python 3.7 to 3.10, Java 8 (1.8)
The following instructions make use of Anaconda to meet the minimum requirements:
- Download & install Miniconda (light-weight version of Anaconda).
- (Windows) Once installed, launch the Anaconda Prompt.
- Create a virtual environment:
This creates a virtual environment called
$ conda create -n accelerometer python=3.9 openjdk pipaccelerometerwith Python version 3.9, OpenJDK, and Pip. - Activate the environment:
You should now see
$ conda activate accelerometer(accelerometer)written in front of your prompt. - Install
accelerometer:$ pip install accelerometer
You are all set! The next time that you want to use accelerometer, open the Anaconda Prompt and activate the environment (step 4). If you see (accelerometer) in front of your prompt, you are ready to go!
To extract summary movement statistics from an Axivity file (.cwa):
$ accProcess data/sample.cwa.gz

 <output written to data/sample-outputSummary.json>
 <time series output written to data/sample-timeSeries.csv.gz>
Movement statistics will be stored in a JSON file:
{
    "file-name": "sample.cwa.gz",
    "file-startTime": "2014-05-07 13:29:50",
    "file-endTime": "2014-05-13 09:49:50",
    "acc-overall-avg(mg)": 32.78149,
    "wearTime-overall(days)": 5.8,
    "nonWearTime-overall(days)": 0.04,
    "quality-goodWearTime": 1
}
See Data Dictionary for the list of output variables.
Actigraph and GENEActiv files are also supported, as well as custom CSV files. See Usage for more details.
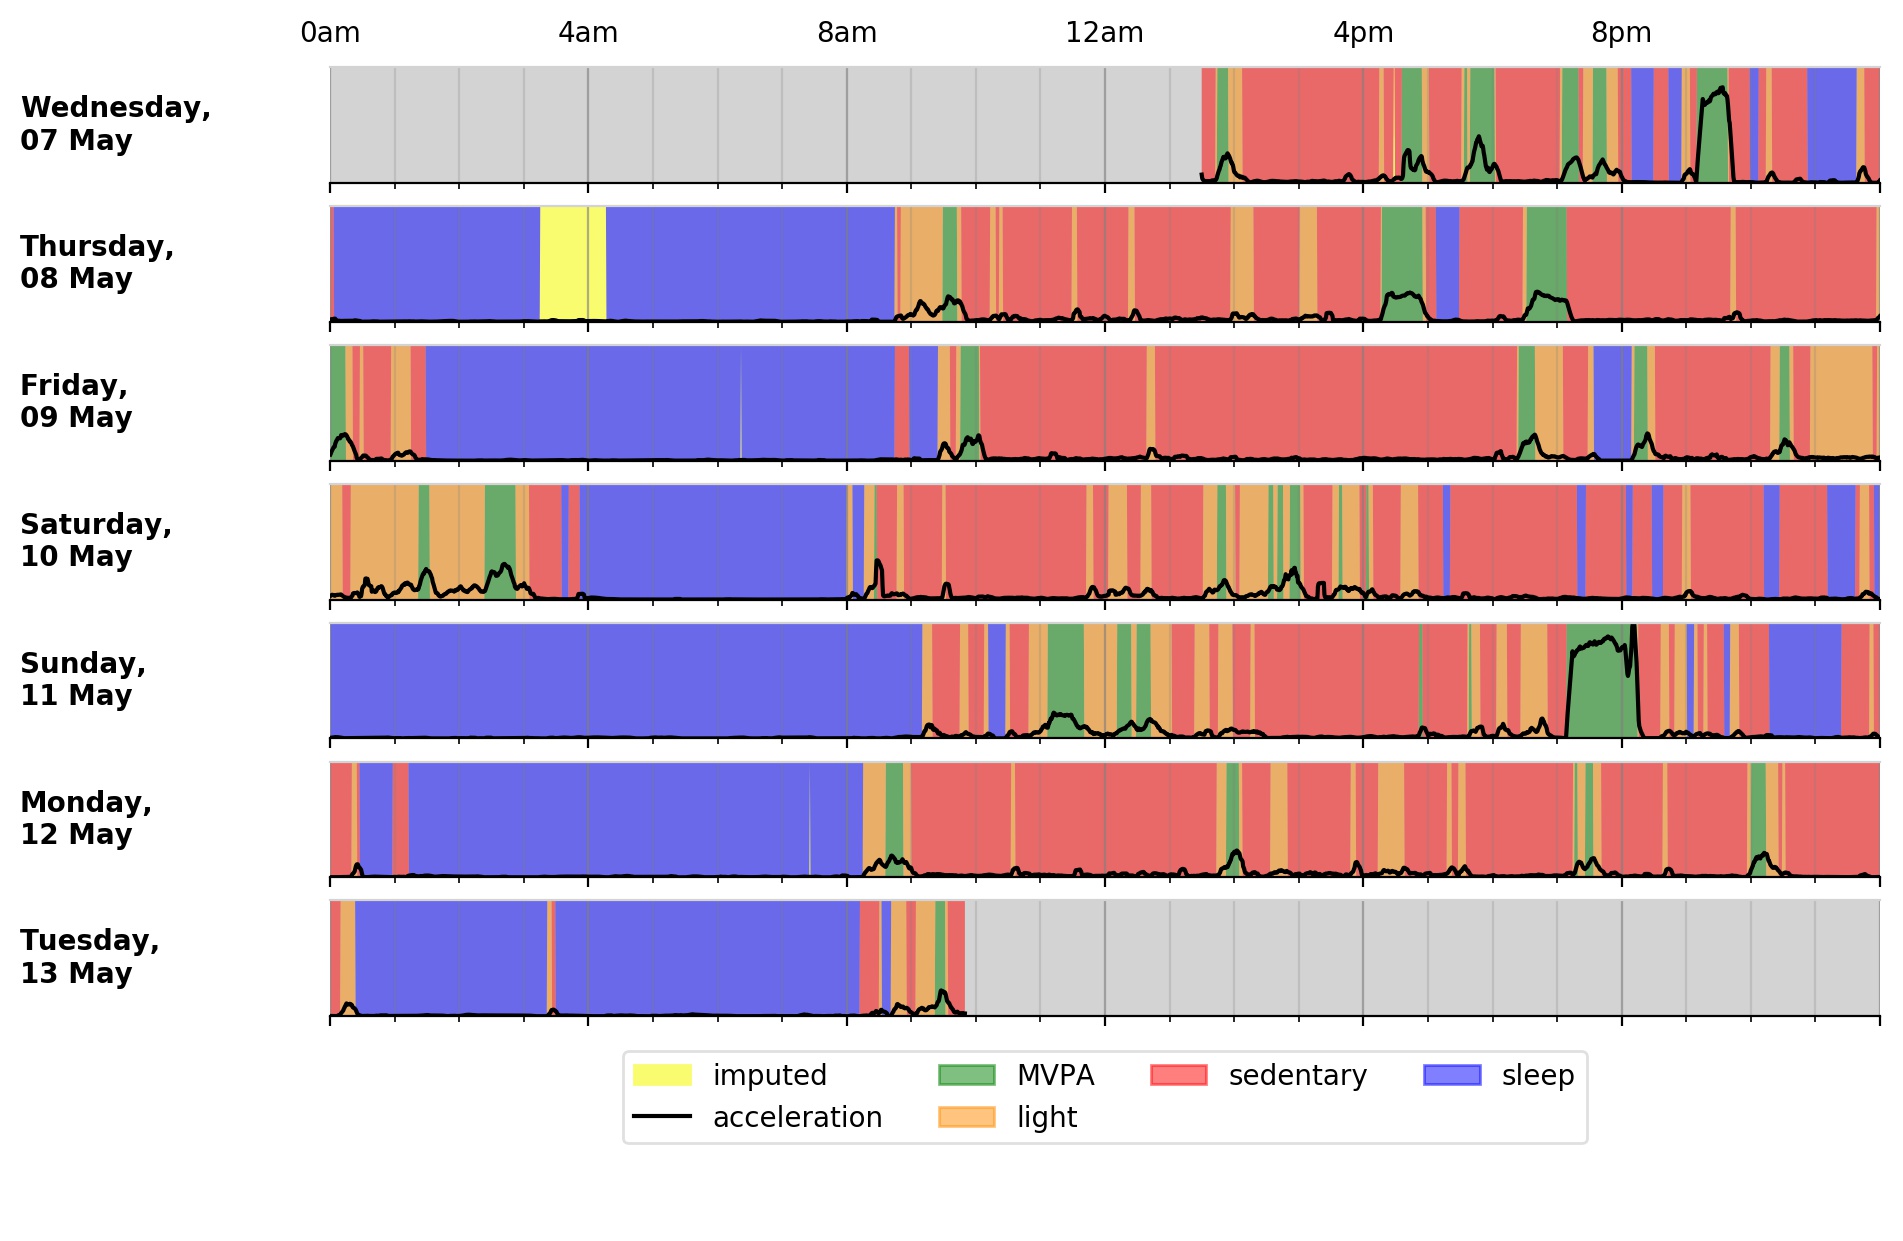
To plot the activity profile:
$ accPlot data/sample-timeSeries.csv.gz
<output plot written to data/sample-timeSeries-plot.png>Some systems may face issues with Java when running the script. If this is your case, try fixing OpenJDK to version 8:
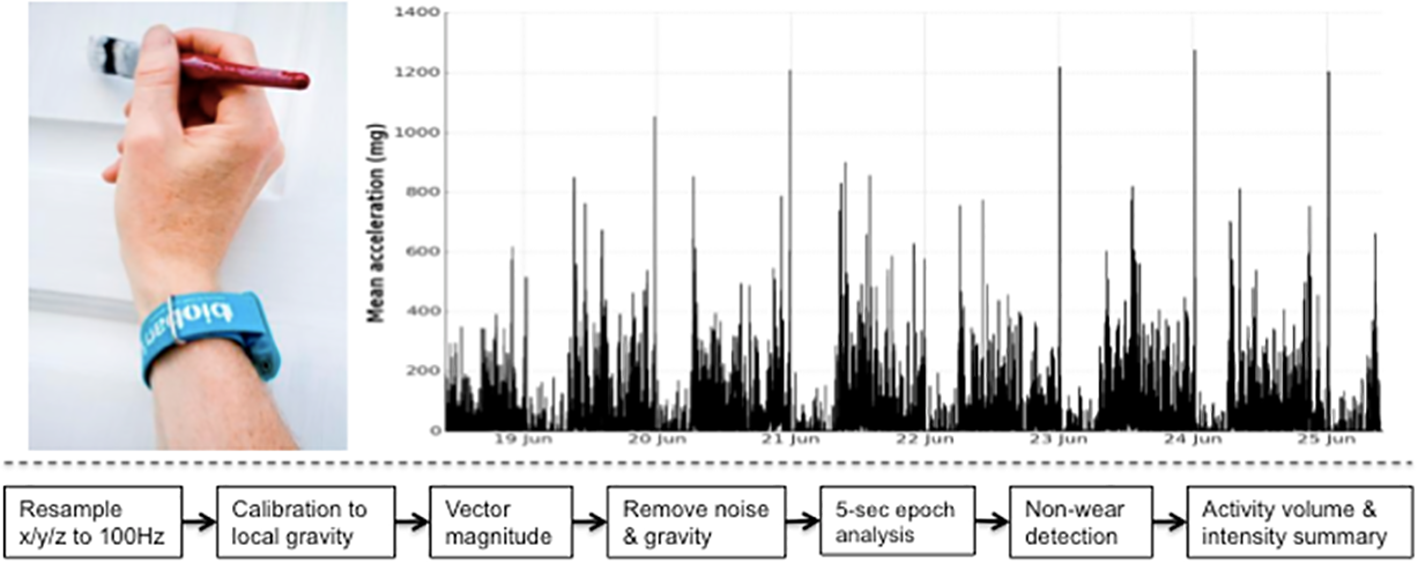
$ conda install -n accelerometer openjdk=8Interpreted levels of physical activity can vary, as many approaches can be taken to extract summary physical activity information from raw accelerometer data. To minimise error and bias, our tool uses published methods to calibrate, resample, and summarise the accelerometer data.
See Methods for more details.
When using this tool, please consider the works listed in CITATION.md.
See LICENSE.md.
We would like to thank all our code contributors and manuscript co-authors.


