This project is created to analyze green energy stocks, particularly DAQO New Energy Corp (DQ), and determine the most efficient ones based on their performance (amount sold and return) for diversification of investment funds using Excel and VBA.
First I calculated Total Daily Volume (amount of sold DQ stocks) and Return (difference between the stock prices at the end of the year 2018 to the beginning of the year 2018) using code:
Sub DQAnalysis()

    Worksheets("DQ Analysis").Activate

    Range("A1").Value = "DAQO (Ticker: DQ)"

    'Create a header row
    Cells(3, 1).Value = "Year"
    Cells(3, 2).Value = "Total Daily Volume"
    Cells(3, 3).Value = "Return"

    Worksheets("2018").Activate

    Dim startingPrice As Double
    Dim endingPrice As Double

    ' Establish the number of rows to loop over
    rowStart = 2
    'DELETE: rowEnd = 3013
    'rowEnd code taken from https://stackoverflow.com/questions/18088729/row-count-where-data-exists
    rowEnd = Cells(Rows.Count, "A").End(xlUp).Row
    'set initial volume to zero
    totalVolume = 0

    'loop over all the rows
    For i = rowStart To rowEnd

        If Cells(i, 1).Value = "DQ" Then
            'increase totalVolume if ticker is "DQ"
            totalVolume = totalVolume + Cells(i, 8).Value
        End If

        If Cells(i, 1).Value = "DQ" And Cells(i - 1, 1).Value <> "DQ" Then
            startingPrice = Cells(i, 6).Value
        End If

        If Cells(i, 1).Value = "DQ" And Cells(i + 1, 1).Value <> "DQ" Then
            endingPrice = Cells(i, 6).Value
        End If


    Next i

    'MsgBox (totalVolume)

    Worksheets("DQ Analysis").Activate
    Cells(4, 1).Value = 2018
    Cells(4, 2).Value = totalVolume
    Cells(4, 3).Value = (endingPrice / startingPrice) - 1

End Sub
In 2018 DQ showed the negative return -63%. That means that DQ stocks decreased in price about 63%.
To find better stocks to invest in I calculated Total Daily Volume and Return for all other stocks in 2018 and 2017 using code:
Sub AllStocksAnalysis()

    Dim startTime As Single
    Dim endTime As Single

    Worksheets("All Stocks Analysis").Activate

    Dim yearValue As String
    yearValue = InputBox("What year would you like to run the analysis on?")

    startTime = Timer

    Range("A1").Value = "All Stocks (" + yearValue + ")"

    'Create a header row
    Cells(3, 1).Value = "Ticker"
    Cells(3, 2).Value = "Total Daily Volume"
    Cells(3, 3).Value = "Return"

    '2) Initialize array of all tickers
   Dim tickers(11) As String

   tickers(0) = "AY"
   tickers(1) = "CSIQ"
   tickers(2) = "DQ"
   tickers(3) = "ENPH"
   tickers(4) = "FSLR"
   tickers(5) = "HASI"
   tickers(6) = "JKS"
   tickers(7) = "RUN"
   tickers(8) = "SEDG"
   tickers(9) = "SPWR"
   tickers(10) = "TERP"
   tickers(11) = "VSLR"

    '3a) Initialize variables for starting price and ending price
    Dim startingPrice As Double
    Dim endingPrice As Double
   '3b) Activate data worksheet
    Sheets(yearValue).Activate

   '3c) Get the number of rows to loop over
    RowCount = Cells(Rows.Count, "A").End(xlUp).Row
   '4) Loop through tickers
   For i = 0 To 11
       ticker = tickers(i)
       totalVolume = 0
       '5) loop through rows in the data
       Worksheets(yearValue).Activate
       For j = 2 To RowCount
           '5a) Get total volume for current ticker
            If Cells(j, 1).Value = ticker Then
            'increase totalVolume
                totalVolume = totalVolume + Cells(j, 8).Value
            End If
           '5b) get starting price for current ticker
            If Cells(j, 1).Value = ticker And Cells(j - 1, 1).Value <> ticker Then
                startingPrice = Cells(j, 6).Value
            End If
           '5c) get ending price for current ticker
            If Cells(j, 1).Value = ticker And Cells(j + 1, 1).Value <> ticker Then
                endingPrice = Cells(j, 6).Value
            End If
       Next j
       '6) Output data for current ticker
    Worksheets("All Stocks Analysis").Activate
    Cells(4 + i, 1).Value = ticker
    Cells(4 + i, 2).Value = totalVolume
    Cells(4 + i, 3).Value = (endingPrice / startingPrice) - 1

   Next i

    endTime = Timer
    MsgBox ("This code ran in " & (endTime - startTime) & " seconds for the year " & (yearValue))

End Sub
I also added buttons and formatted the table to make it easier to understand for users using code:
Sub ClearWorksheet()
    Cells.Clear
End Sub
for "Clear the table" button and code:
Sub formatAllStocksAnalysisTable()

    Worksheets("All Stocks Analysis").Activate
    Range("A3:C3").Font.Bold = True
    Range("A3:C3").Borders(xlEdgeBottom).LineStyle = xlContinuous
    Range("A1").Font.Size = 14
    Range("A1").Font.Color = vbBlue
    Range("A1").Font.Bold = True
    Range("B4:B15").NumberFormat = "#,##0"
    Range("C4:C15").NumberFormat = "0.00%"
    Columns("B").AutoFit

    dataRowStart = 4
    dataRowEnd = 15
    For i = dataRowStart To dataRowEnd

        If Cells(i, 3) > 0 Then

            'Color the cell green
            Cells(i, 3).Interior.Color = vbGreen

        ElseIf Cells(i, 3) < 0 Then

            'Color the cell red
            Cells(i, 3).Interior.Color = vbRed

        Else

            'Clear the cell color
            Cells(i, 3).Interior.Color = xlNone

        End If

    Next i
End Sub
for "Format the table " button.
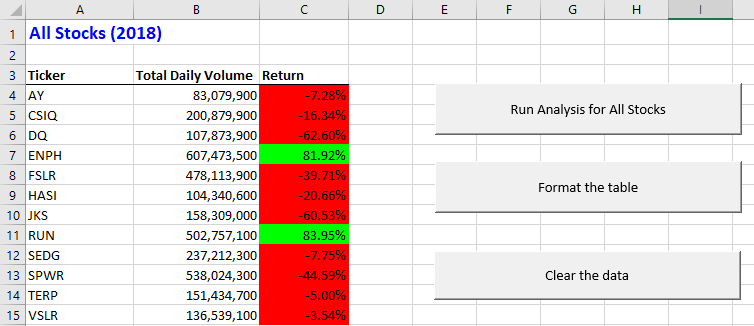
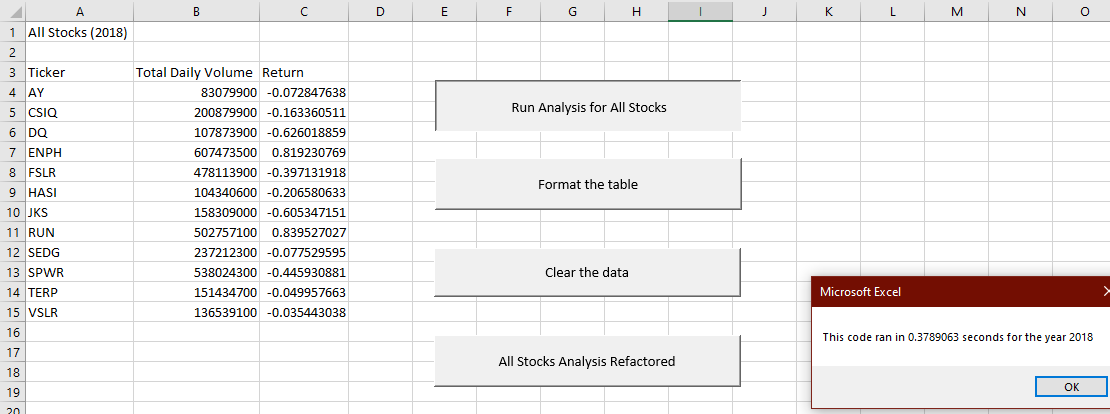
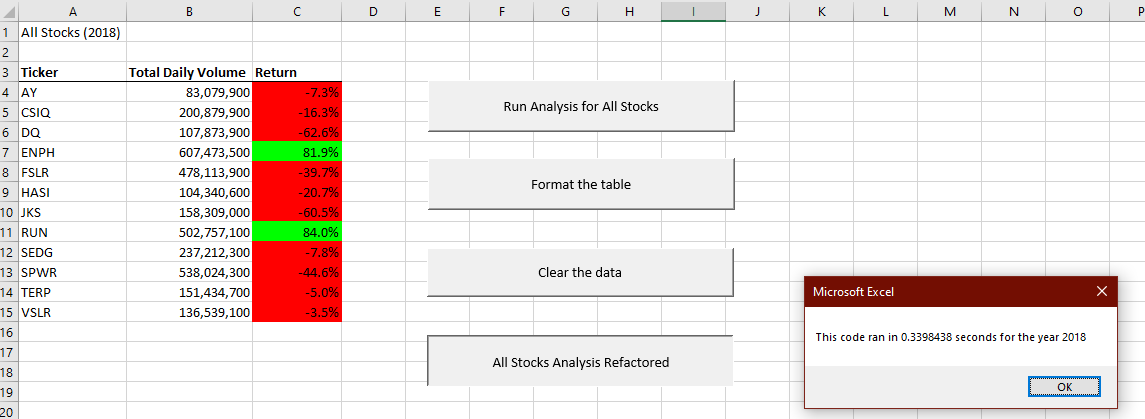
As a result of this analysis we can see that only two of twelve stocks showed positive dynamics in 2018: "ENPH" and "RUN":
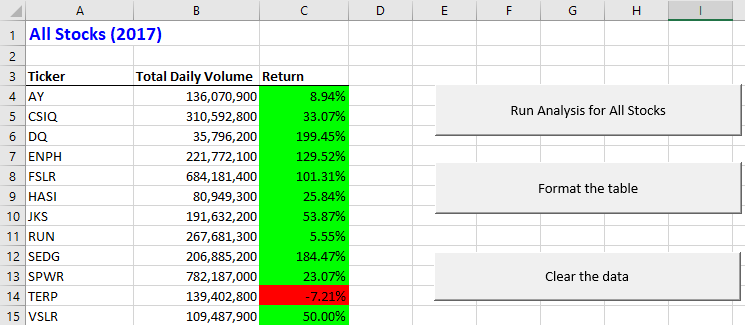
2017 though was a pretty successful year for almost all the stocks including "DQ":
Stocks "ENPH" show good results for two years in a row what makes them attractive to invest in. "RUN" increased in price in 2017 less than others did but the dynamics is still positive. "DQ" raised well in 2017 (by almost 200%) but dropped in 2018 by 63%.
If calculate the approximate two-years-term outcome we get
(x+2x) -- (x+2x)*0.63 = 3x -- 1.89x = 1.11x
what means that "DQ" stocks raised by 11% - still positive result but pretty risky.
This script works well for twelve stocks but might be a little slow for a bigger amount of stocks because it performs all the operations (activation the right worksheet, calculations and output) inside of one for-loop. To make it work faster we can separate parts that can work independently and don't need to be repeated for every step of the for-loop like
- Making tikerVolume = 0 for every ticker
- Activation the right worksheet
- Output the values into All Stocks Analysis worksheet using new arrays (tickerVolumes(), tickerStartingPrice() and tickerEndingPrice()).
After doing all these steps and adding the formatting part into the code I got:
Sub AllStocksAnalysisRefactored()

    Dim startTime As Single
    Dim endTime  As Single
    Dim yearValue As String
    Dim ticker As String

    yearValue = InputBox("What year would you like to run the analysis on?")

    startTime = Timer

    'Format the output sheet on All Stocks Analysis worksheet
    Worksheets("All Stocks Analysis").Activate

    Range("A1").Value = "All Stocks (" + yearValue + ")"

    'Create a header row
    Cells(3, 1).Value = "Ticker"
    Cells(3, 2).Value = "Total Daily Volume"
    Cells(3, 3).Value = "Return"

    'Initialize array of all tickers
    Dim tickers(12) As String

    tickers(0) = "AY"
    tickers(1) = "CSIQ"
    tickers(2) = "DQ"
    tickers(3) = "ENPH"
    tickers(4) = "FSLR"
    tickers(5) = "HASI"
    tickers(6) = "JKS"
    tickers(7) = "RUN"
    tickers(8) = "SEDG"
    tickers(9) = "SPWR"
    tickers(10) = "TERP"
    tickers(11) = "VSLR"

    'Activate data worksheet
    Worksheets(yearValue).Activate

    'Get the number of rows to loop over
    RowCount = Cells(Rows.Count, "A").End(xlUp).Row

    '1a) Create a ticker Index
    Dim tickerIndex As Integer
    tickerIndex = 0

    '1b) Create three output arrays
    Dim tickerVolumes(12) As Long
    Dim tickerStartingPrices(12) As Single
    Dim tickerEndingPrices(12) As Single

    ''2a) Create a for loop to initialize the tickerVolumes to zero.
    For tickerIndex = 0 To 11
        tickerVolumes(tickerIndex) = 0
    Next tickerIndex

    For tickerIndex = 0 To 11
        ticker = tickers(tickerIndex)
    ''2b) Loop over all the rows in the spreadsheet.
        Worksheets(yearValue).Activate
        For i = 2 To RowCount
            If Cells(i, 1).Value = ticker Then
        '3a) Increase volume for current ticker
                tickerVolumes(tickerIndex) = tickerVolumes(tickerIndex) + Cells(i, 8).Value
            End If

        '3b) Check if the current row is the first row with the selected tickerIndex.
        'If  Then
            If Cells(i, 1).Value = ticker And Cells(i - 1, 1).Value <> ticker Then
                tickerStartingPrices(tickerIndex) = Cells(i, 6).Value

        'End If
            End If
        '3c) check if the current row is the last row with the selected ticker
            If Cells(i, 1).Value = ticker And Cells(i + 1, 1).Value <> ticker Then
                tickerEndingPrices(tickerIndex) = Cells(i, 6).Value
            End If
         'If the next row’s ticker doesn’t match, increase the tickerIndex.
        'If  Then
            'DELETE If Cells(i, 1).Value = ticker And Cells(i + 1, 1).Value <> ticker Then

            '3d Increase the tickerIndex.
                'DELETE tickerIndex = tickerIndex + 1

        'End If
            'DELETE End If  Othewise it doesn't work

        Next i
    Next tickerIndex

    '4) Loop through your arrays to output the Ticker, Total Daily Volume, and Return.
    For i = 0 To 11

        Worksheets("All Stocks Analysis").Activate
        Cells(4 + i, 1).Value = tickers(i)
        Cells(4 + i, 2).Value = tickerVolumes(i)
        Cells(4 + i, 3).Value = (tickerEndingPrices(i) / tickerStartingPrices(i)) - 1

    Next i

    'Formatting
    Worksheets("All Stocks Analysis").Activate
    Range("A3:C3").Font.FontStyle = "Bold"
    Range("A3:C3").Borders(xlEdgeBottom).LineStyle = xlContinuous
    Range("B4:B15").NumberFormat = "#,##0"
    Range("C4:C15").NumberFormat = "0.0%"
    Columns("B").AutoFit

    dataRowStart = 4
    dataRowEnd = 15

    For i = dataRowStart To dataRowEnd

        If Cells(i, 3) > 0 Then

            Cells(i, 3).Interior.Color = vbGreen

        Else

            Cells(i, 3).Interior.Color = vbRed

        End If

    Next i

    endTime = Timer
    MsgBox "This code ran in " & (endTime - startTime) & " seconds for the year " & (yearValue)

End Sub
Let's compare the execution time of these two codes.
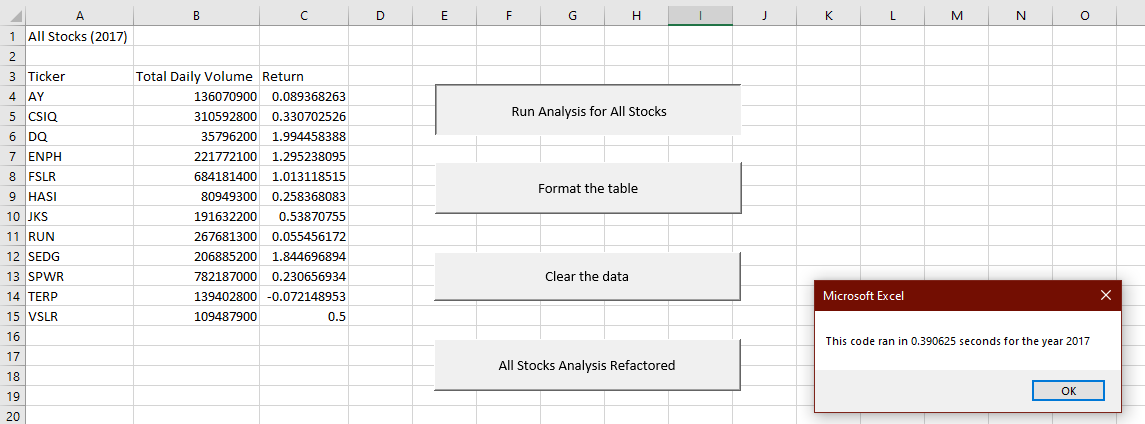
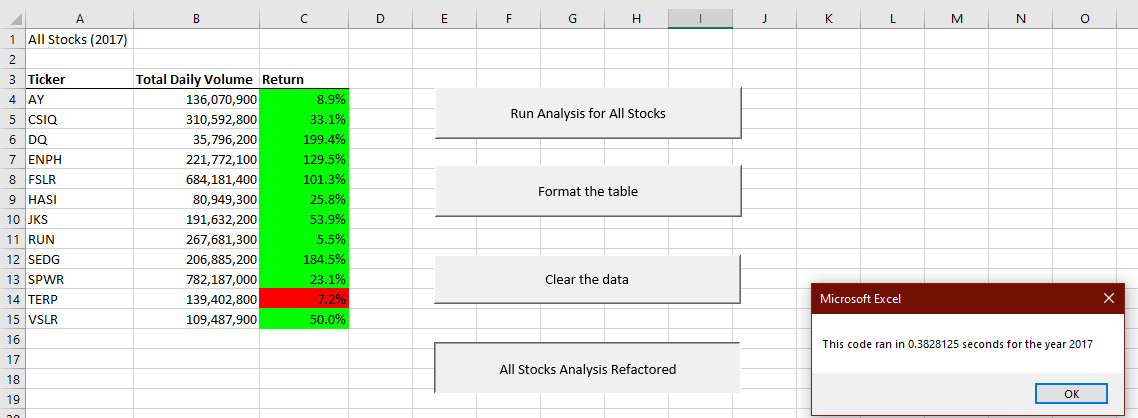
For 2017 year
Original code:
Refactored one:
Even though in second code we calculated the time needed to make all the calculations and formatting it is still 0.01 seconds less than for executing first one for just calculations.
Same for the 2018 year:
Original code:
Refactored one:
Again the refactored code is 0.04 seconds faster than original one.
-
It makes the calculations faster
-
The code is less logically complex, easier to understand
-
Less steps are taken to get results
-
Less memory is used
-
Simplifies support and code updates
-
Saves time and money in future
-
Maintainability and scalability
-
Finding hidden bugs and fixing them.
- Refactoring is time-consuming.
- Made the code work faster
- The code looks less complex, easier to understand
- Less steps are taken to get results.
- Refactoring is time-consuming
- Had to create new and rename some old variables and arrays which can be confusing.

