MTHawkeye is profiling, debugging tools for iOS used in Meitu. It's designed to help iOS developers improve development productivity and assist in optimizing the App performance.
During the App product development cycle, we introduced MTHawkeye to help us discover, find, analyze, locate, and solve problems faster.
- Development phase, focusing on development and debugging assistance, detect problems in a timely manner, and prompt developers to deal with them.
- Test phase, focusing on collecting performance data as much as possible from the test case, for generating automated test analysis reports.
- Online phase, focusing on performance data that needs by our own business but missing from third party APM components.
MTHawkeye has built-in some common performance detection plug-ins. It also introduces and improves FLEX as a plug-in for debugging assistance. When you use MTHawkeye, you can customize and add the plug-ins you need.
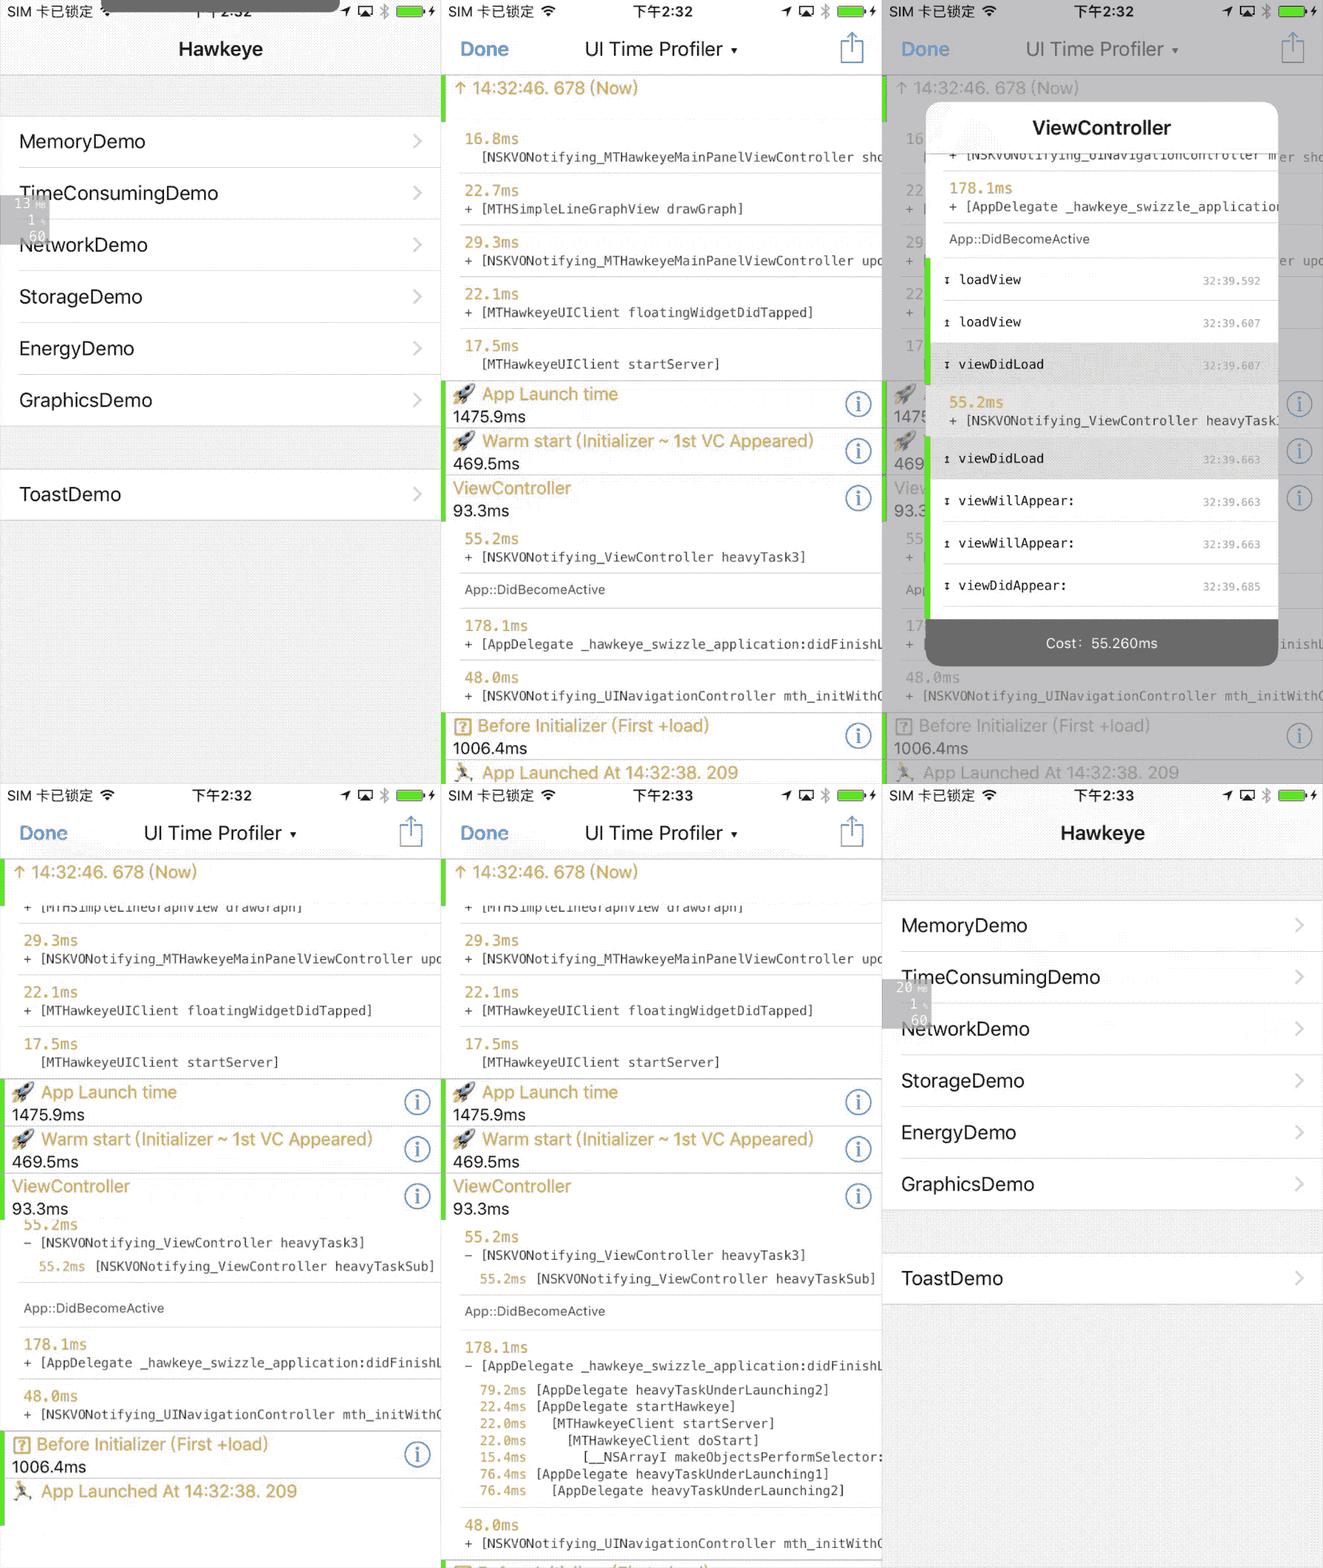
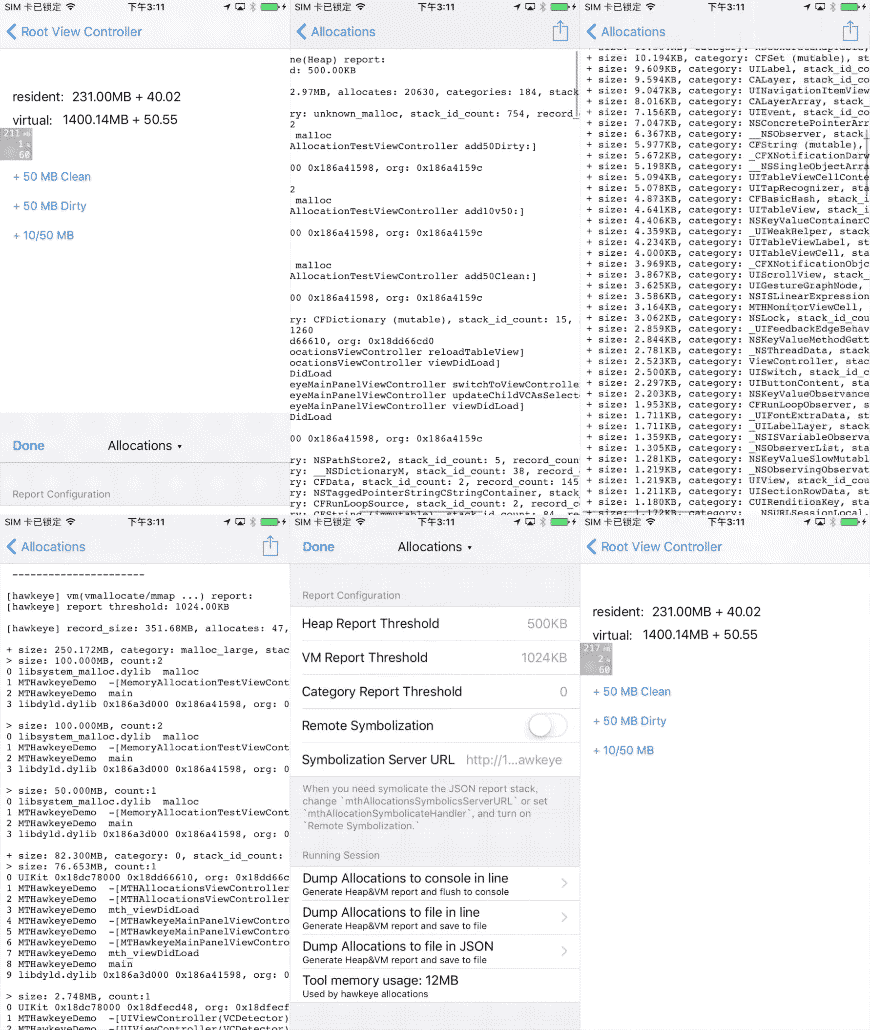
The following are demo diagrams of some built-in plugins for View time-consuming methods on main Thread, View App memory allocations details, View network transaction records. See the post for more plugin instructions.
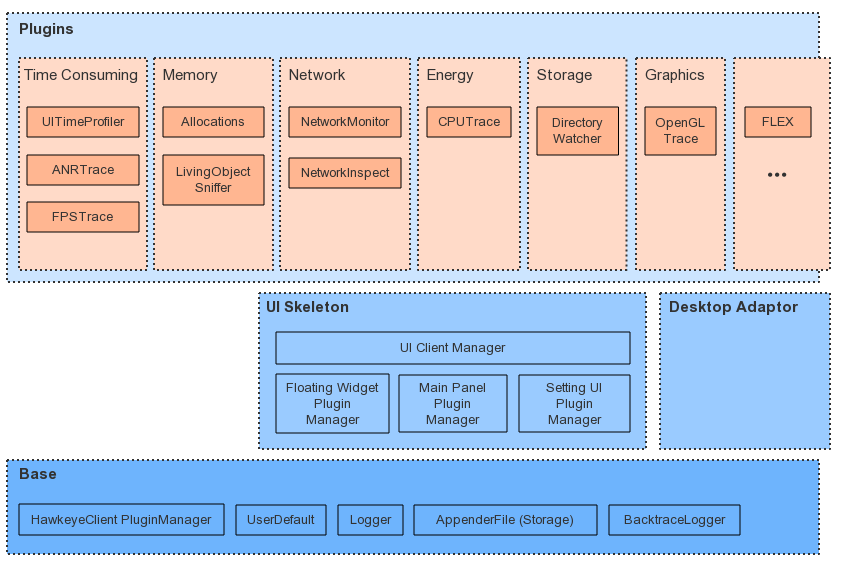
MTHawkeye can be divided into upper, middle and lower layers. In addition to the bottom Base layer, the middle is the UI Skeleton and Desktop Adaptor, the uppermost plug-ins are internally split according to different scenarios. You can optionally add these plugins to your own scenario. The overall structure is as follows:
The Base layer mainly provides plugin management capabilities, storage API and util classes.
UI Skeleton provides an interface interaction framework for the development and testing phase. It includes a floating window, the main panels frame, and a setting panel, all of which can be modified, and the plug-in can integrate the interface interaction.
The built-in plugins are divided into Memory, TimeConsuming, Energy, Network, Graphics, Storage, Utility according to the focus points.
LivingObjectSniffer is mainly used to track and observe objects directly or indirectly held by ViewController, as well as custom View objects. Detects whether these objects are unexpected alive, which may cause by leaks, not released in time, or unnecessary memory buffers.
In the development and testing phase, the detected unexpected alive objects can be prompted to the developer in the form of floating windows flash warning or toast.
In the automated test, the recorded unexpected alive objects can also be extracted for the further memory usage analysis.
Allocations is similar to the Instrument's Allocations module, It tracks the memory details actually allocated by the application. When the application memory usage is abnormal (abnormal rise, OOM exit), the recorded memory allocation details can be used to analyze specific memory usage issues.
UITimeProfiler is used to assist in optimizing the time-consuming tasks of the main thread.
The data collection part mainly includes two components, VC Life Trace and ObjC CallTrace. VC Life Trace tracking the time of each key node when opening ViewController, and when ObjC CallTrace is turned on, it can track Objective-C methods that are executed on the main thread and take longer than the specified threshold.
The interface layer part combines the two parts of data to make it easier for developers to find out the time-consuming details of the operations they are focusing on. The example diagram is as shown in the previous section, for a more detailed description, see the UITimeProfiler plugin documentation.
After enabling the plug-in on the automated test or online phase, without other code, you can continuously automate tracking the startup, page open, and other critical processes time-consuming.
# ANRTrace
ANRTrace is used to capture the stuck event, and will sample the main thread stack frame when the jam occurs.
# FPSTrace
FPSTrace is used to track the interface FPS and OpenGL flush FPS, and display the current value on the floating window.
# CPUTrace
CPUTrace is used to track the CPU's continuous high-load usage, and will recording which methods are mainly called during the high-load CPU usage.
BackgoundTask trace plugin will tracing the begin/end of UIBackgroundTaskIdentifier, it would be useful when try to find out the cause of crash 0xbada5e47. (see the code for usage directly)
NetworkMonitor observes and records HTTP(S) network transactions with metrics info in the App. Providing built-in records viewing interface for a developer to troubleshoot network problems.
- Inherit FLEX's network recording logic, and optimize the initialization logic, greatly reducing the impact by hooking on startup time.
- For NSURLSession after iOS 9, add the URLSessionTaskMetrics record to view the time of each stage of the transaction.
- Add a waterfall view similar to Chrome network debugging based on transaction metrics, to view the queue and concurrency of network transactions, and do further optimization.
- Add the ability to detect duplicate unnecessary network transactions.
- Enhanced search bar to support multi-condition search (host filter, status filter)
- Record the network transaction with request header, request body, response body.
NetworkInspect is based on NetworkMonitor. Depending on the actual of the network transaction, checking whether the network request can be improved according to the inspection rules, and you can add your own inspection rules by yourself.
OpengGLTrace is used to track the memory usage of OpenGL resources, and to help find OpenGL API error calls and exception parameter passing.
DirectoryWatcher is used to track the size of the specified sandbox folders, it also integrates FLEX's sandbox file browser.
# FLEX
FLEX is commonly used in daily development, MTHawkeye adds it as a plugin and extends the use of AirDrop for sandboxed files.
If you need to extend the plugin to the desktop, such as viewing and processing the data on the desktop collected by the plugins, you can get the data based on the interface provided by each plugin, and then bridge to the protocol provided by the third-party desktop client. Such as
First, add an MTHawkeye reference to the project podfile:
  #< Only used during Debug
  #< Since the podfile dependency doesn't support environment configuration,
  #< the dependent pods also need to be explicitly configured as Debug.

  def hawkeye
    pod 'MTHawkeye', :configurations => 'Debug'

    pod 'FLEX', :configurations => ['Debug']
    pod 'FBRetainCycleDetector', :configurations => ['Debug']
    pod 'fishhook', :configurations => ['Debug']
    pod 'CocoaLumberjack', :configurations => ['Debug'] # CocoaLumberjack is optional, change to `MTHawkeye/DefaultPluginsWithoutLog` if don't need.
    # pod 'MTGLDebug', :configurations => ['Debug'] # MTGLDebug is exclude by default, change `MTHawkeye` to `MTHawkeye/DefaultPlugins` to include.

    pod 'MTAppenderFile', :configurations => ['Debug']
  end

  target "YourProject" do
    hawkeye

    # ...
  end
Then, turn on the MTHawkeye service when the App starts, You can use all the plugins as default, or choose the plugins you need to start.
A: Quickly integrate all default plugins and start:
#ifdef DEBUG
  #import <MTHawkeye/MTRunHawkeyeInOneLine.h>
#endif

- (BOOL)application:(UIApplication *)application didFinishLaunchingWithOptions:(NSDictionary *)launchOptions {
#ifdef DEBUG
  [MTRunHawkeyeInOneLine start];
#endif
  // ...
}
B: Select the required plugins, insert new plugins externally:
- (BOOL)application:(UIApplication *)application didFinishLaunchingWithOptions:(NSDictionary *)launchOptions {
  [self startCustomHawkeye];
  // ...
}

- (void)startCustomHawkeye {
#ifdef DEBUG
  [[MTHawkeyeClient shared]
    setPluginsSetupHandler:^(NSMutableArray<id<MTHawkeyePlugin>> *_Nonnull plugins) {
      [MTHawkeyeDefaultPlugins addDefaultClientPluginsInto:plugins];

      // add your additional plugins here.
    }
    pluginsCleanHandler:^(NSMutableArray<id<MTHawkeyePlugin>> *_Nonnull plugins) {
      // if you don't want to free plugins memory, remove this line.
      [MTHawkeyeDefaultPlugins cleanDefaultClientPluginsFrom:plugins];

      // clean your additional plugins if need.
    }];

  [[MTHawkeyeClient shared] startServer];

  [[MTHawkeyeUIClient shared]
    setPluginsSetupHandler:^(NSMutableArray<id<MTHawkeyeMainPanelPlugin>> *_Nonnull mainPanelPlugins, NSMutableArray<id<MTHawkeyeFloatingWidgetPlugin>> *_Nonnull floatingWidgetPlugins, NSMutableArray<id<MTHawkeyeSettingUIPlugin>> *_Nonnull defaultSettingUIPluginsInto) {
      [MTHawkeyeDefaultPlugins addDefaultUIClientMainPanelPluginsInto:mainPanelPlugins
                                    defaultFloatingWidgetsPluginsInto:floatingWidgetPlugins
                                          defaultSettingUIPluginsInto:defaultSettingUIPluginsInto];


        // add your additional plugins here.
    }
    pluginsCleanHandler:^(NSMutableArray<id<MTHawkeyeMainPanelPlugin>> *_Nonnull mainPanelPlugins, NSMutableArray<id<MTHawkeyeFloatingWidgetPlugin>> *_Nonnull floatingWidgetPlugins,NSMutableArray<id<MTHawkeyeSettingUIPlugin>> *_Nonnull defaultSettingUIPluginsInto) {
      // if you don't want to free plugins memory, remove this line.
      [MTHawkeyeDefaultPlugins cleanDefaultUIClientMainPanelPluginsFrom:mainPanelPlugins
                                      defaultFloatingWidgetsPluginsFrom:floatingWidgetPlugins
                                            defaultSettingUIPluginsFrom:defaultSettingUIPluginsInto];

      // clean your additional plugins if need.
    }];

  dispatch_async(dispatch_get_main_queue(), ^(void) {
    [[MTHawkeyeUIClient shared] startServer];
  });
#endif
}There may be special requirements during the test phase, or may not need to retain the code for the interface while publishing the App. At this point, you can create a new podspec according to the needs, introduce the needed sub-spec to the pod-spec, and then add it into the podfile.
pod 'YourOnlineHawkeye', :podspec => 'xxx/yourOwnHawkeyeOnline.podspec', :configurations => 'Release'Then in the initialization, load the plugin as your needs, configure whether the plugin should start. such as
#ifdef Release
  [MTHawkeyeUserDefaults shared].allocationsTraceOn = YES; // trun on allocations this time.

  [[MTHawkeyeClient shared]
    setPluginsSetupHandler:^(NSMutableArray<id<MTHawkeyePlugin>> *_Nonnull plugins) {
      [plugins addObject:[MTHAllocationsHawkeyeAdaptor new]];

      // add your additional plugins here.
    }
    pluginsCleanHandler:^(NSMutableArray<id<MTHawkeyePlugin>> *_Nonnull plugins) {

    }];

  [[MTHawkeyeClient shared] startServer];
#endif- Floating window
- Show and hide floating window: three-finger long press gesture for two seconds or a three-finger left swipe gesture.
- Show and hide floating window widget: Enter Setting view, then select
Floating Window, switch the widget to show or hide.
- Main panels: tap the floating window to view the plugin panel you viewed last time.
- Setting view: Enter the main panel, tap the title unfold the switching module view, top the
Settingon the upper right corner.
Interface interaction documentation for each plugin: see links above
If you have a module that needs to avoid a lot of pits during development, or if you have a lot of debugging/optimization related logging code during development, consider writing a debugging aid and then importing this component into MTHawkeye based on the MTHawkeye API. Used in the framework to unify interactions and interfaces.
If the performance metrics you care about are not continuously tracked during automated testing, consider writing a profiling plugin to collect performance data.
For detail: MTHawkeye plugin development Guide
For more information about contributing issues or pull requests, see MTHawkeye Contributing Guide。
- FLEX
- Tencent Mars
- PLeakSniffer
- FBRetainCycleDetector
- iOS Memory Monitor in WeChat
- Deep into iOS performance profiling
- RSSwizzle
- fishhook
- CocoaLumberjack
MTHawkeye is under MIT license,See the LICENSE file for details.


