This project uses a input data all geotagged tweets from the year 2020 to determine the frequency of different hashtags across different languages, countries, and times during the first year of the pandemic.
To do this this I ran the command
python3 ./src/map.py --input_path=/data/Twitter\ dataset/geoTwitter20-01-01.zip
to run the map.py file. This file goes through a day's worth of geotagged tweets and obtains the creates a couple of files for the given day geoTwitter20-01-01.zip.lang and geoTwitter20-01-01.zip.country. These two files contain the use of the hashtags in each country and language in that particular day.
To get this for all days of the year and not just January 1st, I created the runmaps.sh file that runs the maps.py file on every the zip files corresponding to every day of the year. To run this file I used the command
nohup sh runmaps.sh &
After running this command I closed my computer, went to sleep and let the program run in the background.
After obtaining all the files for each day. The commands
python3 ./src/reduce.py --input_paths outputs/geoTwitter20-*.lang --output_path=reduced.lang
and
python3 ./src/reduce.py --input_paths outputs/geoTwitter20-*.country --output_path=reduced.country
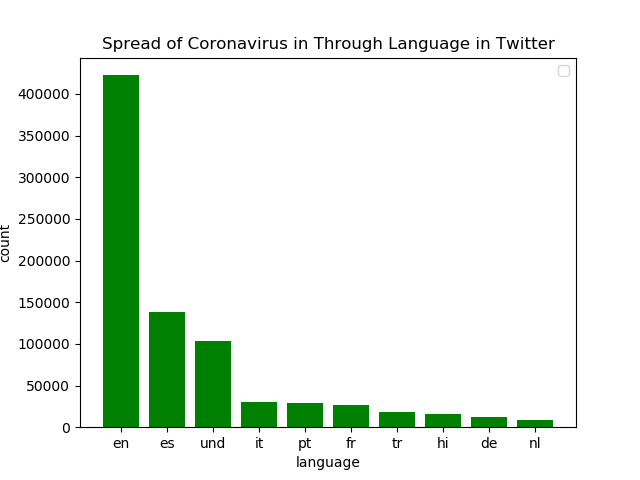
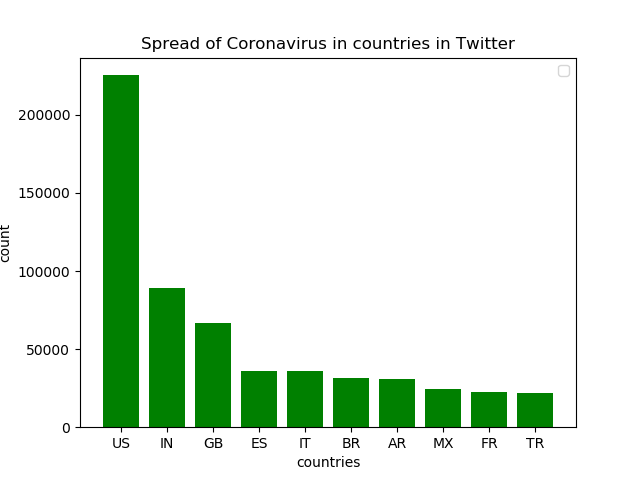
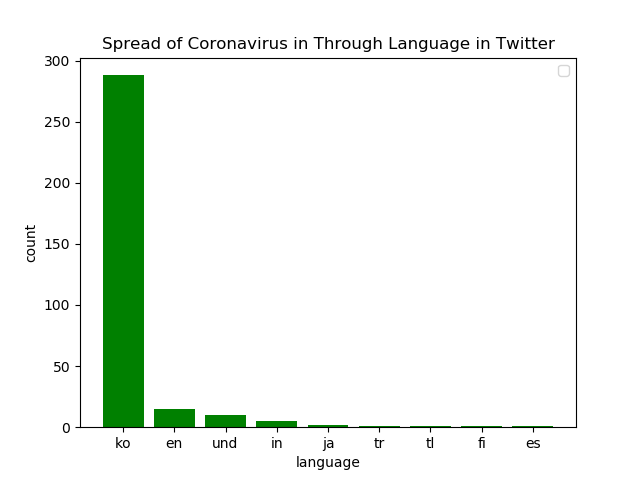
consolidated the information from the outputs folder into two files reduced.lang reduced.country. The visualize.py file uses matplotlibs to graph the distribution of the use of a given hashtag across the top 10 most frequent countries or languages depending on the input file.
Bellow are the graphs and their corresponding commands
python3 ./src/visualize.py --input_path=reduced.lang --key='#coronavirus'
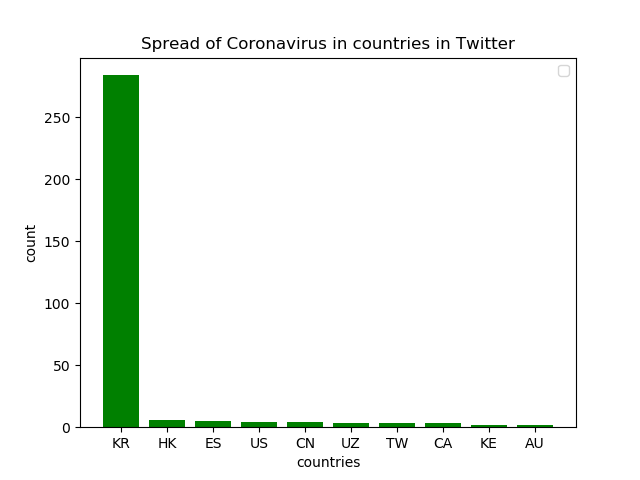
python3 ./src/visualize.py --input_path=reduced.country --key='#coronavirus'
python3 ./src/visualize.py --input_path=reduced.lang --key='##코로나바이러스'
python3 ./src/visualize.py --input_path=reduced.country --key='##코로나바이러스'
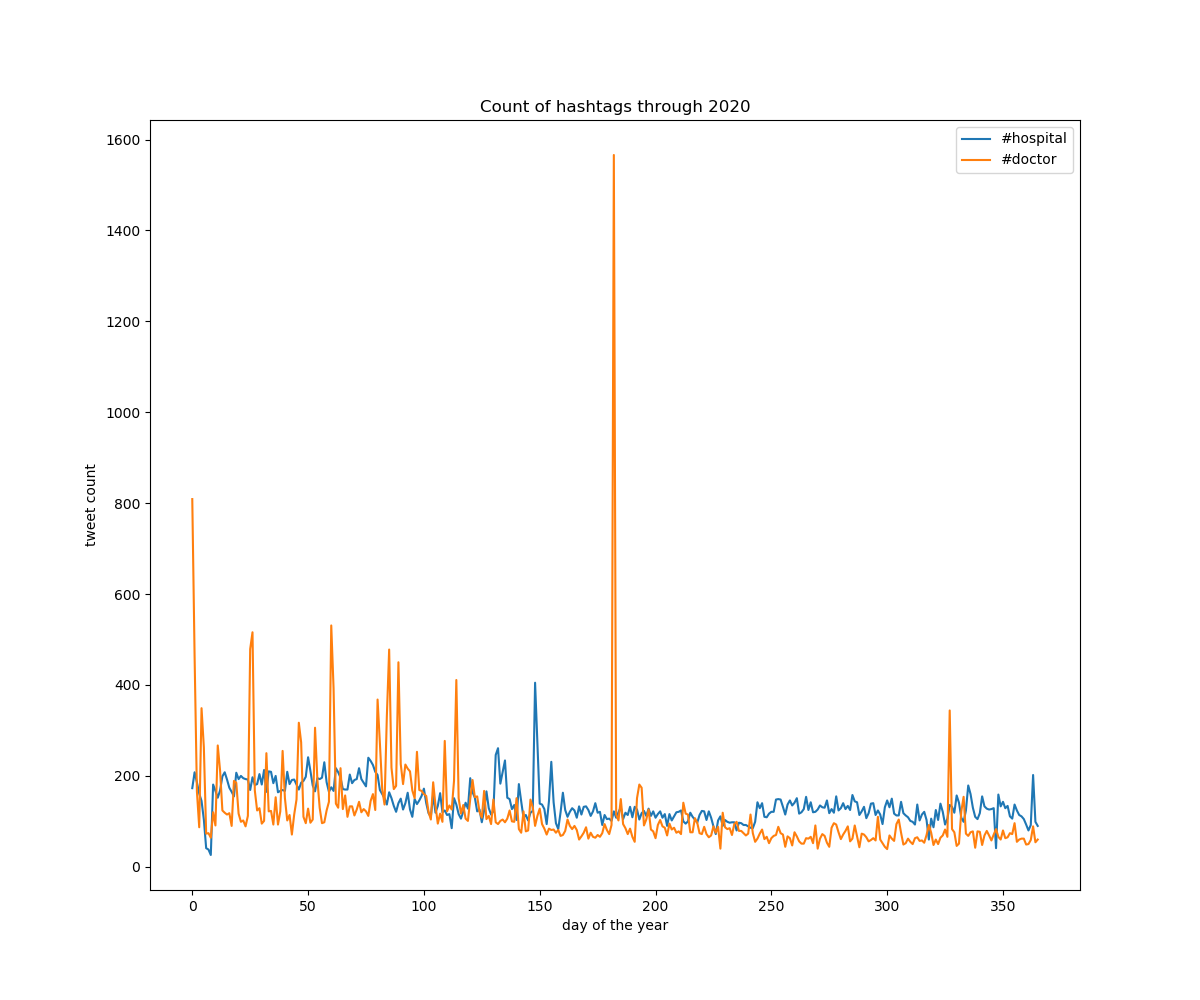
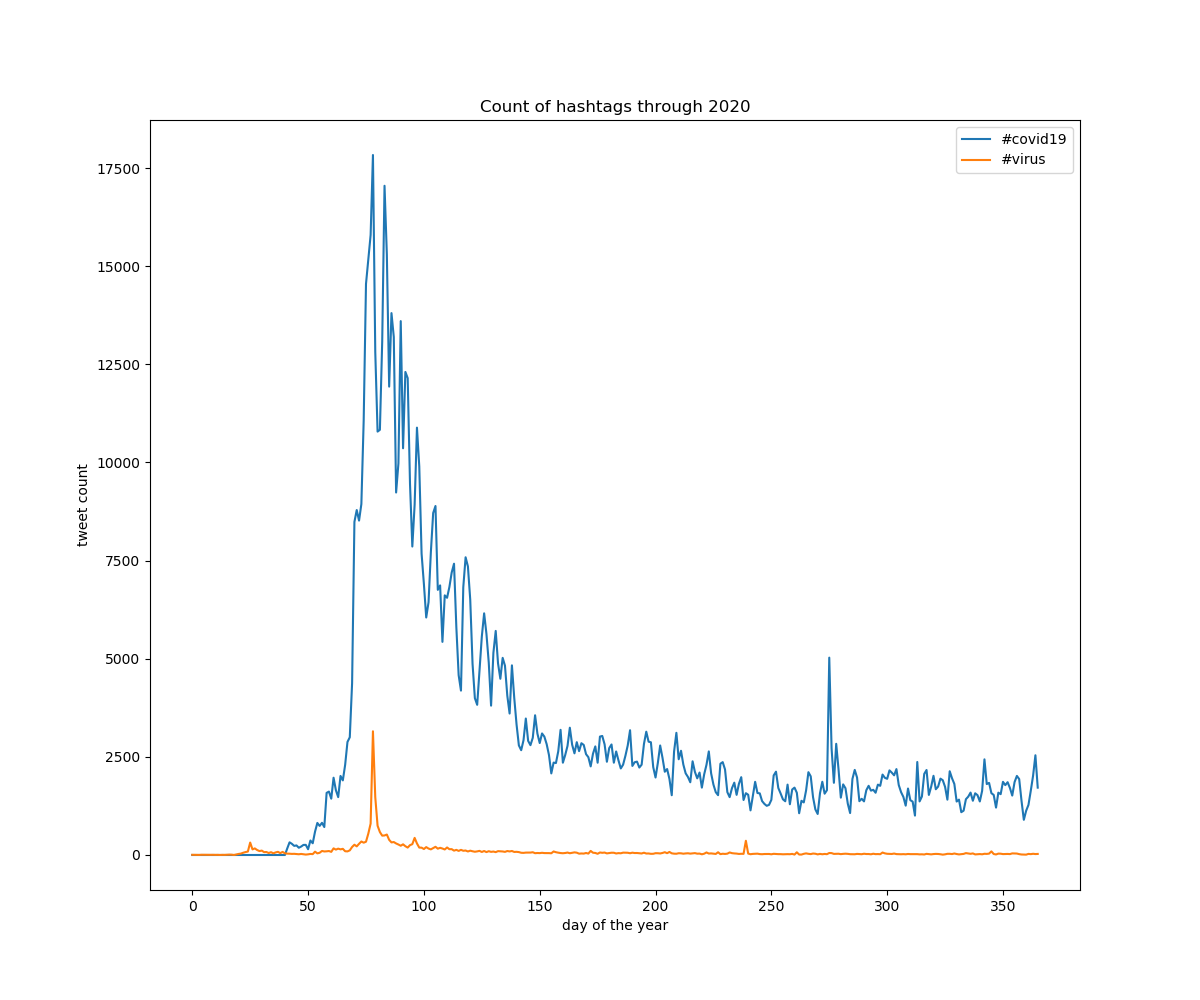
Finally, I created another file which takes as input a list of hashtags, loops over each file on the outputs folder a graph containing the use of those particular hashtags across all of 2020.
Below are the graphs and their corresponding commands
python3 ./alternative_reduce.py --input_hashtags '#covid19' '#virus'
python3 ./alternative_reduce.py --input_hashtags '#hospital' '#doctor'