Using the PT Application Inspector plugin for Azure DevOps, you can configure a template to start a pipeline through which settings will be sent to start a scan.
The scan start settings and source code will be sent to the server specified in the template.
PT AI contributes to higher product quality and reduces time for software development and QA as well as the labor intensity typical for manual analysis of vulnerabilities.
You can read more about PT AI operation in the user documentation supplied with the main PT AI product package.
For the plugin to operate correctly, you need the following:
- Configured Azure DevOps build agents configured
- AI.Shell
- PT AI Enterprise Agent connected to PT AI Enterprise Server
AI.Shell is a light cross-platform agent that sends a scan task to the PT AI Enterprise Server module, and PT AI Enterprise Server queues the task to be performed by an available PT AI Enterprise Agent.
For more information about how to configure Azure DevOps build agents for Linux and Windows, visit microsoft.com.
Installing the plugin from Marketplace
To upload the plugin to Marketplace:
-
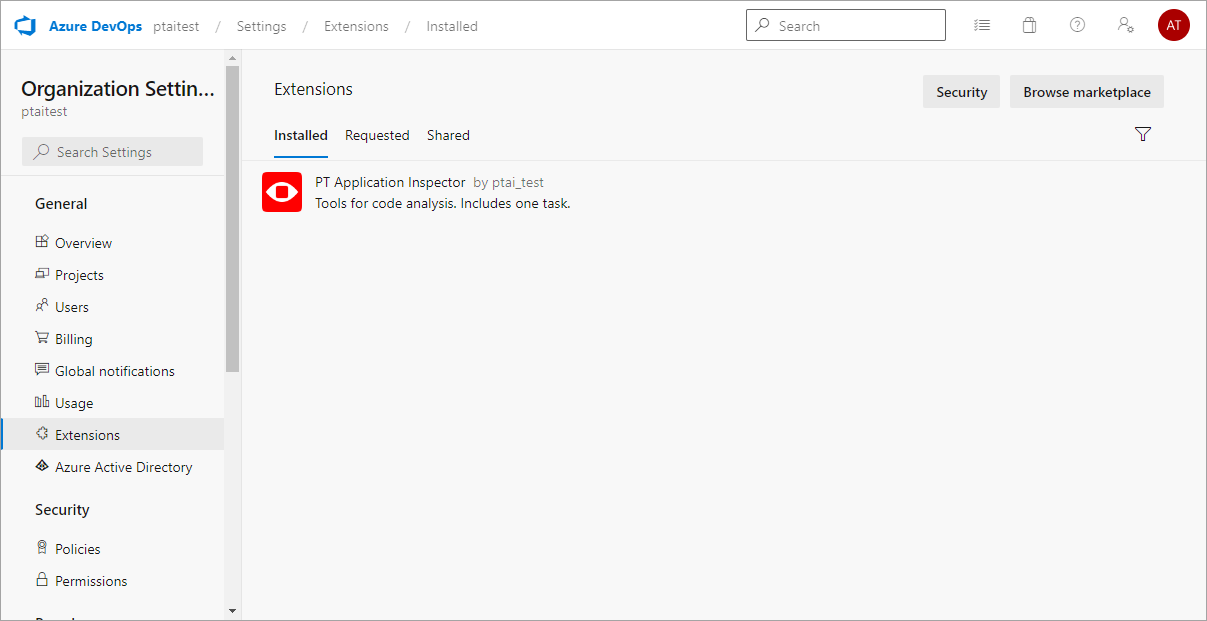
Go to your organization's settings page.
-
Find PT Application Inspector plugin.
-
Click Get it free.
-
Select your organization and click Install.
The plugin is now installed.
Creating a pipeline
After installing the plugin, you need to create a pipeline to start the plugin.
To create a pipeline:
-
Go to your organization's page.
-
On the left side of the page, select Pipelines → New pipeline.
-
Select the version control system that contains source code for scanning.
-
Depending on the version control system, configure the connection to the scan project.
-
Select Starter pipeline.
-
Save the pipeline.
After installing the plugin and creating a pipeline, you can create a separate scan task for each scan project.
To set up a project task:
-
Select your project.
-
To the left, select Pipelines.
-
Select the previously created pipeline.
-
Click Edit.
-
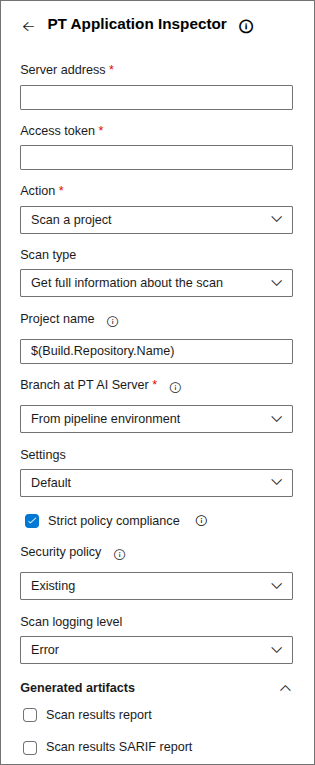
Under Tasks, select the PT Application Inspector task .
-
In the
azure-pipelines.ymlfile, delete the contents of the pool section and writename: default.Note. If you want to scan large projects that take a long time to scan, you must set the scan task timeout in the
azure-pipelines.ymlfile manually. The default value is 60 minutes. For example,timeoutInMinutes 360 report. -
Under PT Application Inspector in the Server Address box, specify the PT AI Enterprise Server address.
-
In the Access token box, enter the access token for the CI/CD plugins created earlier.
-
If you want to start a new scan, in the Action list, select Scan a project.
-
To check the status of the current scan, in the Action list, select Check scan results, and then enter values in the Project ID and Scan result ID boxes.
-
If you need to run a vulnerability check and you want to wait for the scan to finish, in the Scan type list, select Get full information about scan.
-
If you need to run a vulnerability check and continue running the pipeline without waiting for the scan to finish, in the Scan type list, select Send scan on server and end task.
-
In the Project name box, enter the name of the project created in the PT AI web interface.
-
If a scan project is already configured in the PT AI web interface, in the Settings list, select Default.
-
If you want to create a configuration file with the scan settings at the build stage, in the Settings list, select Custom.
Example of the azure-pipelines.yml file with scan settings:
- task: application-inspector-devops@0
  inputs:
    serverAddress: 'https://server_address'
    token: '<token_for_AISA>'
    actionMode: 'scan'
    settingsType: 'enterNew'
    newSettings: |
      {
        "$schema": "https://json.schemastore.org/aiproj-1.1.json",
        "Version": "1.1",
        "ProjectName": "<project_name>",
        "ProgrammingLanguage": "Java",
        "ScanModules": [
            "DataFlowAnalysis"
        ],
        "CustomParameters": null,
        "UseSastRules": false,
        "UseCustomPmRules": false,
        "UseSecurityPolicies": false,
        "SkipGitIgnoreFiles": false,
        "UsePublicAnalysisMethod": true,
        "DownloadDependencies": true,
        "JavaSettings": {
            "Parameters": "",
            "UnpackUserPackages": false,
            "UserPackagePrefixes": "",
            "Version": "v1_8"
        },
        "MailingProjectSettings": {
            "Enabled": false,
            "MailProfileName": null,
            "EmailRecipients": []
        }
      }
    html: true
    sarif: true
To edit the security policy:
-
Under PT Application Inspector, select Strict policy mode to stop the pipeline if the scanned application does not comply with the set security policy.
-
If you want to use an existing security policy rule, in the Security policy list, select Existing.
-
If you want to add a new security policy rule or use a template, in the Security policy list, select New.
Note. In addition, you must check that Check for compliance with the security policy is selected in the web interface or the “UseSecurityPolicies: true” parameter is specified in the configuration file.
Example of the azure-pipelines.yml file with security policy rules:
- task: application-inspector-devops@0
  inputs:
    serverAddress: 'https://server_address'
    token: '<token_for_AISA>'
    actionMode: 'scan'
    policyScanType: 'enterNew'
    newPolicies: |
      [
        {
          "CountToActualize": 0,
          "Scopes": [
            {
              "Rules": [
                {
                "Field": "Level",
                "Value": "High",
                "IsRegex": false
                }
              ]
            }
          ]
        }
      ]
    html: true
    sarif: true
To configure logging:
-
Under PT Application Inspector in the Scan logging level list, select the severity level for events to be logged.
-
Select formats for reports to be generated based on scan results.
-
Start the project pipeline by clicking Save.
If the scan results comply with the security policy, the pipeline will pass successfully.
After the pipeline finishes running, scan reports are available. By clicking build artifacts, you can download the reports in the formats specified during the configuration of the azure-pipelines.yml file. The following formats are available for downloading:
- Scan results report HTML
- Scan results SARIF report
- Autocheck report
- OWASP top 10 2021 report
- PCI DSS 3.2 report
- NIST 800-53 Rev. 4 report
- SANS top 25 report
- OWASP mobile top 10 2016 report
- Report EAL4 (GOST 15408-3)
- Scan results JSON report
- Scan results XML report
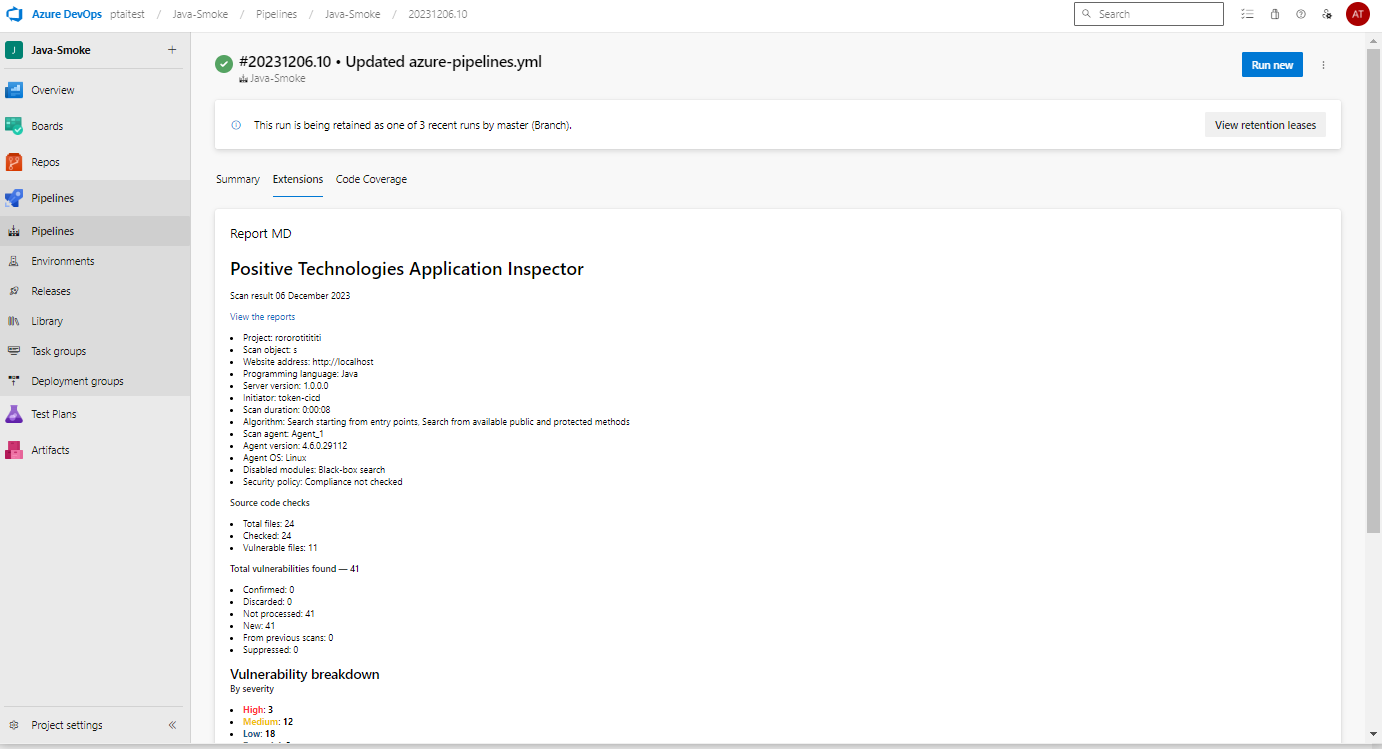
To view the default MD report, go to Pipelines → Runs → Descriptions → Extensions.
The plugin is compatible with the local version of Azure DevOps Server 2020 (update 1.1) and cloud versions of Azure DevOps Services.
For more information about the hardware and software requirements for PT AI Enterprise Server, PT AI Enterprise Agent and AI.Shell, see the Administrator Guide.


