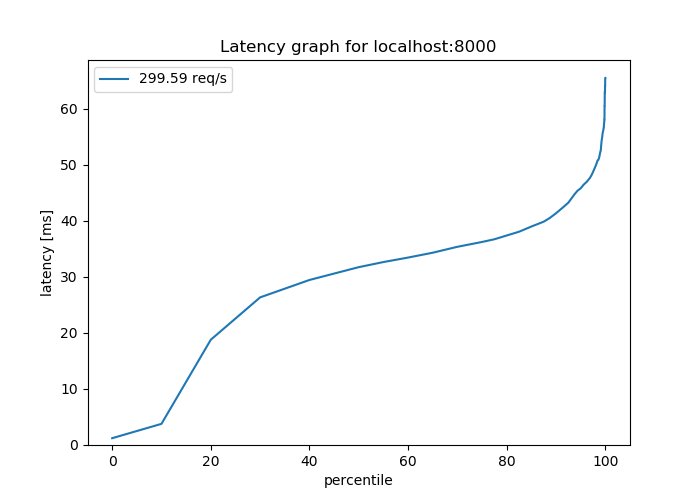
You find wrk and wrk2 awesome for latency analysis but reading km of log file doesnt seems to be fun ?
Introducing wrk2img, your new tool to go to generate latency graph, as easily as possible.
wrk2img has two goal:
- Direct use in a pipeline to output beautiful latency graph
- Save multiple output then pipe to wrk2img to combine them
pip install wrk2img
Python 3.5 is required.
Direct usage :
- wrk :
wrk --latency http://localhost:8000 | wrk2img output.png - wrk2 :
wrk --latency -R 300 http://localhost:8000 | wrk2img output.png

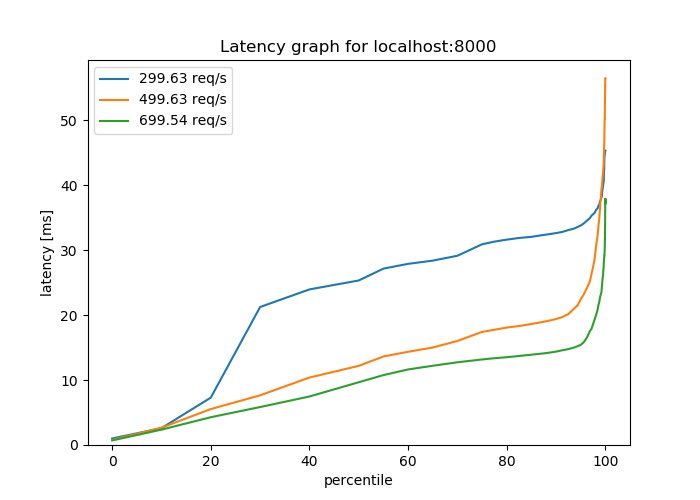
Generating latency data at multiple load level using wrk2 and them combining them
wrk --latency -R 300 http://localhost:8000 > 300
wrk --latency -R 500 http://localhost:8000 > 500
wrk --latency -R 700 http://localhost:8000 > 700
cat 300 500 700 | wrk2img output.png
- log scale
- transparent background
- change background color
- combine graph from wrk and wrk2 in the same output
