Minas Dioletis, Ioannis Z. Emiris, George Ioannakis, Evanthia Papadopoulou, Thomas Pappas, Panagiotis Repouskos, Panagiotis Rigas, and Charalampos Tzamos
We aim to simplify and optimize the process of finding the nearest neighbor in a set of objects given a query point, and a metric. Our method employs a latent-variable generative model for hierarchical clustering, creating a tree structure where nodes represent data space regions, not just centroids. Critics assess and value the edges in this tree-graph, converting it to a weighted graph for navigational decision-making by an actor with a policy. Explicit data embedding in a higher-dimensional space transforms complex shapes into discrete points, enabling divergence calculations for iterative state refinement. This approach, termed GeoCluster, dynamically quantifies data, aligning with its natural structure and distribution, approximating a hierarchical-voronoi structure.

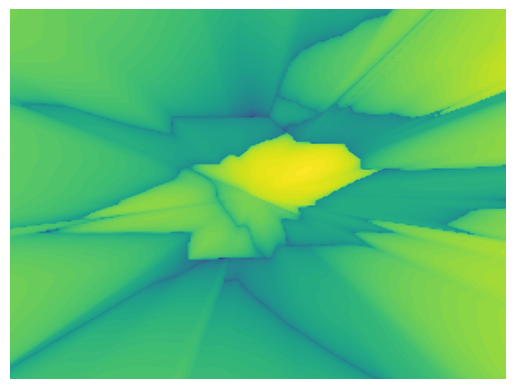
Figure: The regions are defined by the tree leaf nodes.
The model has high accuracy on yellow areas and lower towards the green ones.
Key points of our method are:
- Input Agnostic.
- Simple, since only the metric needs to be defined.
- Fast, since the student is a linear model, and is run on the GPU.
- Great scaling and highly parallelizable
Clone the repository and install the required libraries by running the following in your terminal:
git clone https://github.com/PRigas96/GeoCluster
cd GeoCluster
conda env create -f environment.yml
source activate GeoCluster
or if you are a linux user:
git clone https://github.com/PRigas96/GeoCluster
cd GeoCluster
conda env create -f environment_linux.yml
source activate GeoCluster├─── data # directory for data used in experiments
│ ├── squares # square objects (with rotation)
│ ├── cuboids # cuboid objects (without rotation)
│ └── ellipses # ellipses objects (without rotation)
├─── images # images used for this README
├─── src # contains the source code (more info in src/README.md)
├─── demo.ipynb # demo notebook
└─── environment.yml # Anaconda environment for required libraries (windows)
└─── environment_linux.yml # Anaconda environment for required libraries (linux)
Use the demo provided to get familiar and experiment with the algorithm. The demo uses as input 1000 squares with rotation in 2D and as metric the L∞ distance between a square and a point.
As the algorithm is input-agnostic, any type of data can be utilised as long as they can be embedded in a vector format and can be loaded as a numpy array.
The space dimension should then be defined. This will make the Clustering model cluster the data around centroids of the specified dimension, as well as allow the Critic to make predictions of queries of points in the same dimension.
A metric function should be provided which can calculate the distance between a data vector and a query point as described above.
There are two neural network models and one sampler than can need to be parametrised. See the demo for a detailed list and a brief explanation of the parameters. More information can be found in the models' source code.
Threshold of the number of data contained in a leaf node on the k-tree, for the tree division phase to end.
- Load a dataset:
import numpy as np
dataset = np.load('./your_path/your_data.npy')
- Define the space dimension:
dim = 2 # or any integer depending on your data
- Define a metric function:
def my_metric(data_entry:[float], point:[float]):
  """Function that calculates the distance between a data entry and a point."""
  ...
- Define the arguments for the models and the UN sampler:
clustering_args = {...}
un_args = {...}
critic_args = {...}
- Define a threshold:
threshold = len(dataset) / 100 # or any number or heuristic that works for your data
- Initiate the k-tree:
import torch
from src.k_tree import Ktree

device = torch.device("cuda:0" if torch.cuda.is_available() else "cpu")
ktree = Ktree(threshold, dataset, my_metric, clustering_args, un_args, critic_args, device, dim)
- Create the tree:
ktree.create_tree()
- Run queries for different points in the space dimension defined above:
ktree.query([4, 2])
This project is licensed under the MIT License - see the LICENSE file for details.