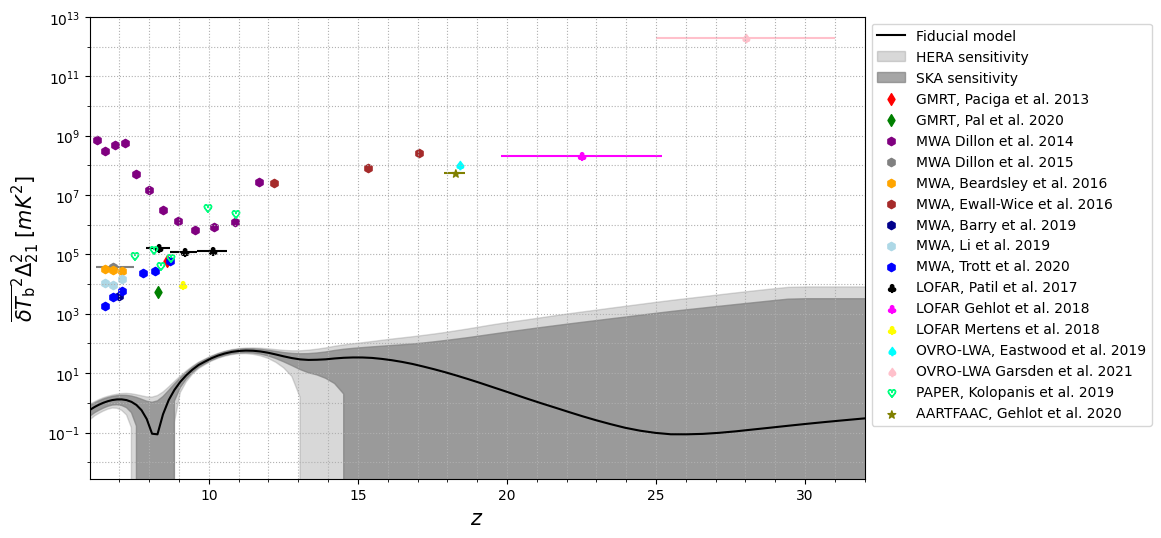
Python script for plotting the current upper limits on the power spectrum of the cosmological 21 cm line. Roughly inspired in arXiv:1907.08211.
The upper limits considered are stored in the data folder. The data files present at least two columns, corresponding to the redshifts z and the power spectrum in units of (mK)^2. If the bound is on a extended range of redshifts, there are two additional columns, with the minimum and maximum redshifts, and thus the first column refers to the mean redshift.
The file list_data.txt includes the bounds to be considered, indicating the name of the data file in the data folder, a label with the name of the experiment and the reference of the upper limit, the color and the marker type.
Scales for most of the upper limits plotted lie within k ~ 0.1 and 0.3 h/Mpc, with few exceptions. The considered experiments, bounds and scales k at which the upper limits correspond are the following:
| File | Reference | arXiv | k [h/Mpc] | Notes |
|---|---|---|---|---|
| GMRT_2013 | Paciga et al. 2013 | 1301.5906 | 0.5 | - |
| GMRT_2020 | Pal et al. 2020 | 2012.04998 | 1.59 | Other k available |
| MWA_2014 | Dillon et al. 2014 | 1304.4229 | ~ 0.1 | Other k available |
| MWA_2015 | Dillon et al. 2015 | 1506.01026 | ~ 0.2 | Other k available |
| MWA_2016_1 | Beardsley et al. 2016 | 1608.06281 | ~ 0.2 | Table 1, Polarization N-S (see reference) |
| MWA_2016_2 | Ewall-Wice et al. 2016 | 1605.00016 | ~ 0.2 | Sec. 4.4 |
| MWA_2019_1 | Barry et al. 2019 | 1909.00561 | 0.2 | - |
| MWA_2019_2 | Li et al. 2019 | 1911.10216 | ~ 0.2 | Table 2. Other k available |
| MWA_2020 | Trott et al. 2020 | 2002.02575 | 0.142 | Table 4. Other k available |
| LOFAR_2017 | Patil et al. 2017 | 1702.08679 | 0.128 | Table 3 (stronger limits at k = 0.053 h/Mpc) |
| LOFAR_2018 | Gehlot et al. 2018 | 1809.06661 | 0.038 | Redshifts between z=19.8−25.2, 3C220 field (see reference) |
| LOFAR_2020 | Mertens et al. 2020 | 2002.07196 | 0.100 | Table 4. Other k available |
| OVRO-LWA_2019 | Eastwood et al. 2019 | 1906.08943 | ~ 0.1 | - |
| OVRO-LWA_2021 | Garsden et al. 2021 | 2102.09596 | 0.3 | Redshifts between z=25−31 |
| PAPER_2019 | Kolopanis et al. 2019 | 1909.02085 | ~ 0.3 | - |
| AARTFAAC_2020 | Gehlot et al. 2020 | 2010.02269 | 0.144 | Redshifts between z=17.9, 18.6, average of two bins (see reference) |
For comparison purposes, a fiducial theoretical model is also included, computed with 21cmFAST (see arXiv:1003.3878, arXiv:1809.08995). By default, the line shown is at k = 0.2 h/Mpc (but this can be modified).
Sensitivity for the HERA and SKA experiments is also shown, being computed for the default configurations with 21cmSense (see arXiv:1210.2413, arXiv:1310.7031).
If you use the code, please link this repository and cite the DOI 10.5281/zenodo.4579904.
For comments, questions etc. you can reach me at pablo.villanueva.domingo@gmail.com
