This is a collection of drone image Dataset collected at Peking University, Huludao city, Henan University and Cangzhou city.
example of UDD:


Class Definitions
| Class | Gt Label | RGB | Suffix |
|---|---|---|---|
| Vegetation | 0 | (0,255,0) | _t.png |
| Building | 1 | (255,0,0) | _b.png |
| Road | 2 | (0,0,255) | _r.png |
| Vehicle | 3 | (128,128,0) | _v.png |
| Other | 4 | (128,128,128) | N/A |
now the 5 classes Dataset is on air(Vegetation, Building, Road, Vehicle, Background). See Download Link below.
This Dataset is only for non-commercial use.
-
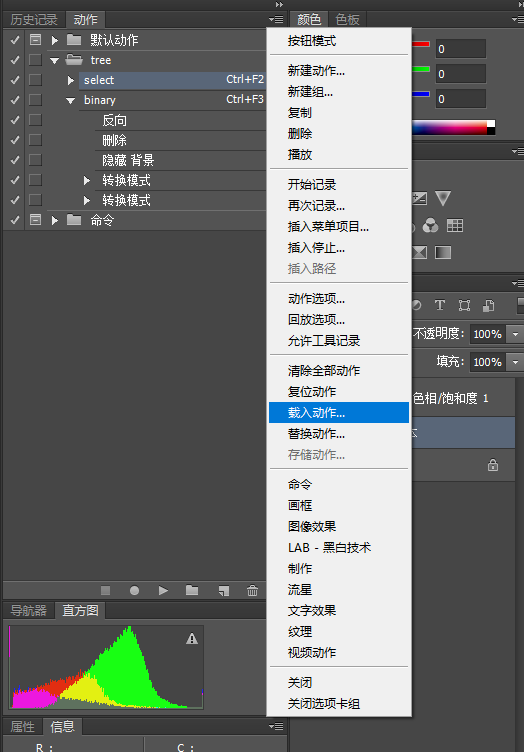
- enter photo shop,press alt+F9 to open Action menu,load action script "tree.atn"
- enter photo shop,press alt+F9 to open Action menu,load action script "tree.atn"
-
- open the src url, and press CTRL+F2,a raw mask of tree would be generated
- open the src url, and press CTRL+F2,a raw mask of tree would be generated
-
- adjust the selected area by hand(lasso is recommended, just press shift/alt and drag the mouse)
-
- then press CTRL+F3 to generate bitmap, save it by "_t.png" suffix,"DJI_0285_t.png",e.g.


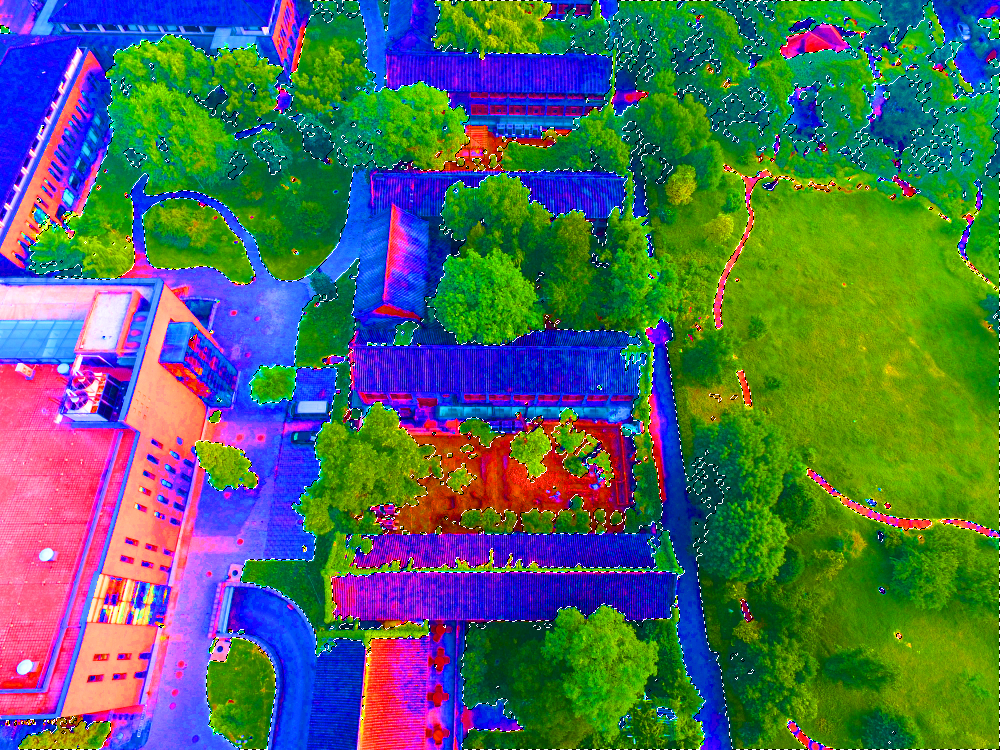
Annotation example

Chinese version of annotation instruction
-
- new a black layer, using polygon lasso to select building and fill it with black
-
- press CTRL+F3 to generate bitmap, save it by "_b.png" suffix,"DJI_0285_t.png",e.g.
example of annotated result

-
- After filled ROI with black, press CTRL+F3 to generate bitmap. Remember to save it by suffix(see Class Definitions above)
/src origin source image
/gt ground truth
/gt_class groundtruth split by classes
/ori annotation raw result(annotated '_t.png', '_b.png', etc. are all here)
/visualization visualization result
you can name your directories arbitrarily. Just keep them corresponded to envs in main.m
Processing with raw annotated result. You can DIY your ground truth label here.
parameters:
visual_mode = 0; % 1 to run this script
visual_resizerate=0.25; % downsample to accelerate
visual_writemode = 0; % 1 to save visualization result
parameters:
split_mode = 1; % 1 to run this script
split_visualmode = 0;  % 1 to visualize
After running main.m, you can see the visualization result in**/visualization** by running this script
parameters:
view_mode = 1; % 0 for automatic, 1 for manual
run this to prepare train.txt,val.txt for training in tensorpack.
Sincerely tribute to all companions who contributed to this Dataset: Xiao Deng(邓枭)、Youpeng Gu(顾友鹏)、Jianyuan Guo(郭健元)、Chen Hou(侯忱)、Zhao Jin(金朝)、Boning Song(宋博宁)、You'er Wen(文佑尔)、Yang Yao(姚洋)、Kangrui Yi(易康睿)、Haotian Zhou(周昊天)、Youkun Wu(吴有堃)、Xupu Wang(王旭普)、Tongwei Zhu(朱彤葳)、Zebin Wang(王泽斌)。