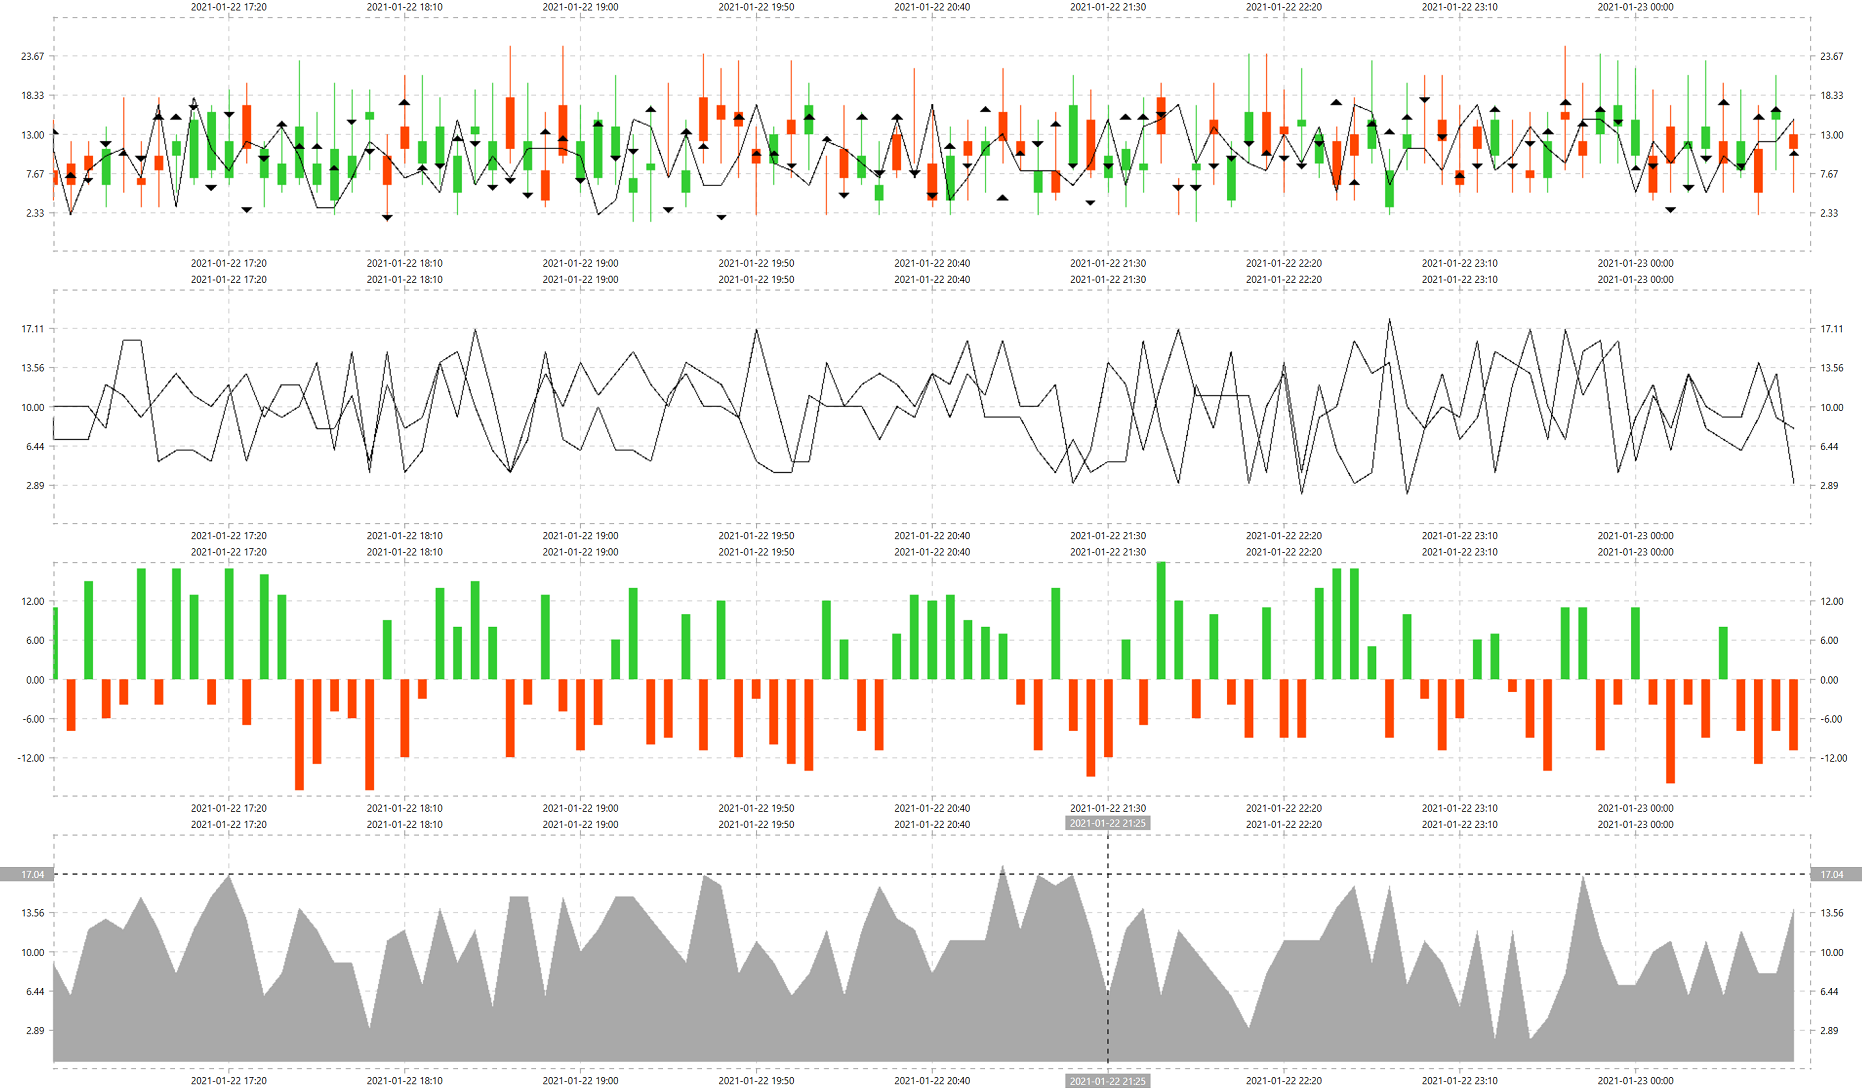
The fastest charting web control targeting primarily Blazor, both Server Side and Web Assembly, and even ASP.NET MVC. This charting library was designed for Web, but it can also be used in Desktop apps via Web View. The main purpose of this library is to be used as a charting tool for real-time financial applications, e.g. backtesters for trading strategies. Here is the most comprehensive guide dedicated to charting in .NET that I have seen so far. Nevertheless, trying various options from that guide I wasn't able to find anything fast and flexible enough for my needs, so created my own.
Install-Package Canvas.Views.Web
Currently available controls.
- Engine - abstract base
Canvascontrol exposing drawing context of various frameworks, likeGDIorSkiaSharp - CanvasEngine - a wrapper around SkiaSharp and Open GL
To add different view types, e.g. GDI+, Direct 2D, Win UI, Open GL, implement IEngine interface.
At the moment, there are four built-in chart types.
- Line - line
- Bar - polygon
- Area - polygon
- Arrow - polygon
- Candle - OHLC box, a mix of a line and a polygon
- HeatMap - polygon
To add new chart types, e.g. Error Bars or Bubbles, implement IGroupModel interface.
The chart is data-centric, thus in order to scale the chart you need to change the data source.
By default, the chart displays last 100 data points, as defined in IndexCount property.
MinIndex = Items.Count - IndexCount
MaxIndex = Items.Count
To pan the chart to the left, subtract arbitrary value from both MinIndex and MaxIndex.
MinIndex -= 1
MaxIndex -= 1
To pan the chart to the right, do the opposite.
MinIndex += 1
MaxIndex += 1
To zoom in, increase MinIndex and decrease MaxIndex to decrease number of visible points.
MinIndex += 1
MaxIndex -= 1
To zoom out, do the opposite.
MinIndex -= 1
MaxIndex += 1The simplest format used by the library is a list of models with a single Point property.
<CanvasWebView @ref="ViewControl"></CanvasWebView>

@code
{
  public CanvasWebView ViewControl { get; set; }

  protected override async Task OnAfterRenderAsync(bool setup)
  {
    if (setup)
    {
      var generator = new Random();

      var points = Enumerable.Range(1, 100).Select(i => new BarItemModel
      {
        X = i,
        Y = generator.Next(-5000, 5000)

      } as IPointModel).ToList();

      await ViewControl.Create(dimensions => ViewControl.Composer = new Composer
      {
        Name = "Demo",
        Items = points,
        Engine = new CanvasEngine(dimensions.X, dimensions.Y)
      });
    }

    await base.OnAfterRenderAsync(setup);
  }
}
In case when charts have to be synchronized or overlapped within the same viewport, data source should have format of a list where each entry point has a time stamp and a set of Areas and Series that will be rendered in the relevant viewport.
[
  DateTime
  {
    Area A
    {
      Line Series => double,
      Candle Series => OHLC
    },
    Area B
    {
      Line Series => double,
      Line Series => double
    },
    Area C
    {
      Bar Series => double
    }
  },
  DateTime { ... },
  DateTime { ... },
  DateTime { ... }
]- Area is a viewport, an actual chart, each viewport can show several types of series, e.g. a mix of candles and lines.
- Series is a single chart type to be displayed in the viewport, e.g. lines.
- Model is a data point of
dynamictype, can accept different type of inputs, e.g. double or OHLC box.
At this moment, Canvas supports only horizontal orientation, so the axis X is used as an index scale that picks data points from the source list and axis Y is a value scale that represents the actual value of each data point.
The current version is already the fastest .NET charting library, but it can be even faster if instead of rerendering HTML elements Blazor will simply show or hide them using CSS.
