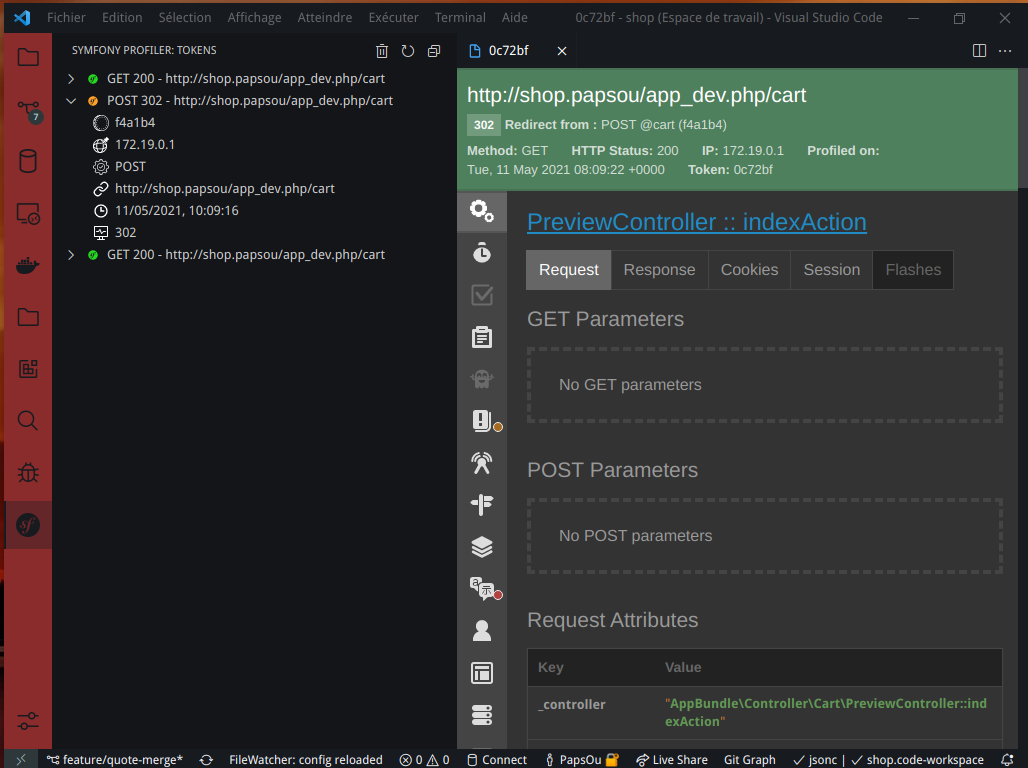
Display symfony profiler tokens directly into VSCode.
Having access to the Symfony's dev cache folder.
This extension have following settings (should be defined in workspace, not global):
papsou-symfony-profiler.symfonyCacheDir: the project root relative cache directory path. e.g:var/cache/devpapsou-symfony-profiler.ignoreUrlRegex: an array of regexp used to ignore some request urls. e.g: ["style\.css$", ".*\.map$"]papsou-symfony-profiler.profilerBaseUrl: the base URL where you access your symfony profiler. e.g:http://127.0.0.1/app_dev.php/_profiler/
No issues
- Remove useless details expanding on tree view item click
- Fix profiler styles
- Fix sf toggle auto scroll-to-top links
- Remove unused svg
- Remove alert message when no profiler is detected
- Fix icons (using native ones)
- Cleanup releases
- Ignore toggle link in profiler for webview navigation
- Dump panel css fix
- Add purge token command
- Fix http 500 icon
- Fix css theme for dump focus and search input
- Clean up releases
- Fix css theme for dump private / protected / public property names
- First release
- Clean up code
- Update README
- Add ignore patterns on profiled URLs
- First release
