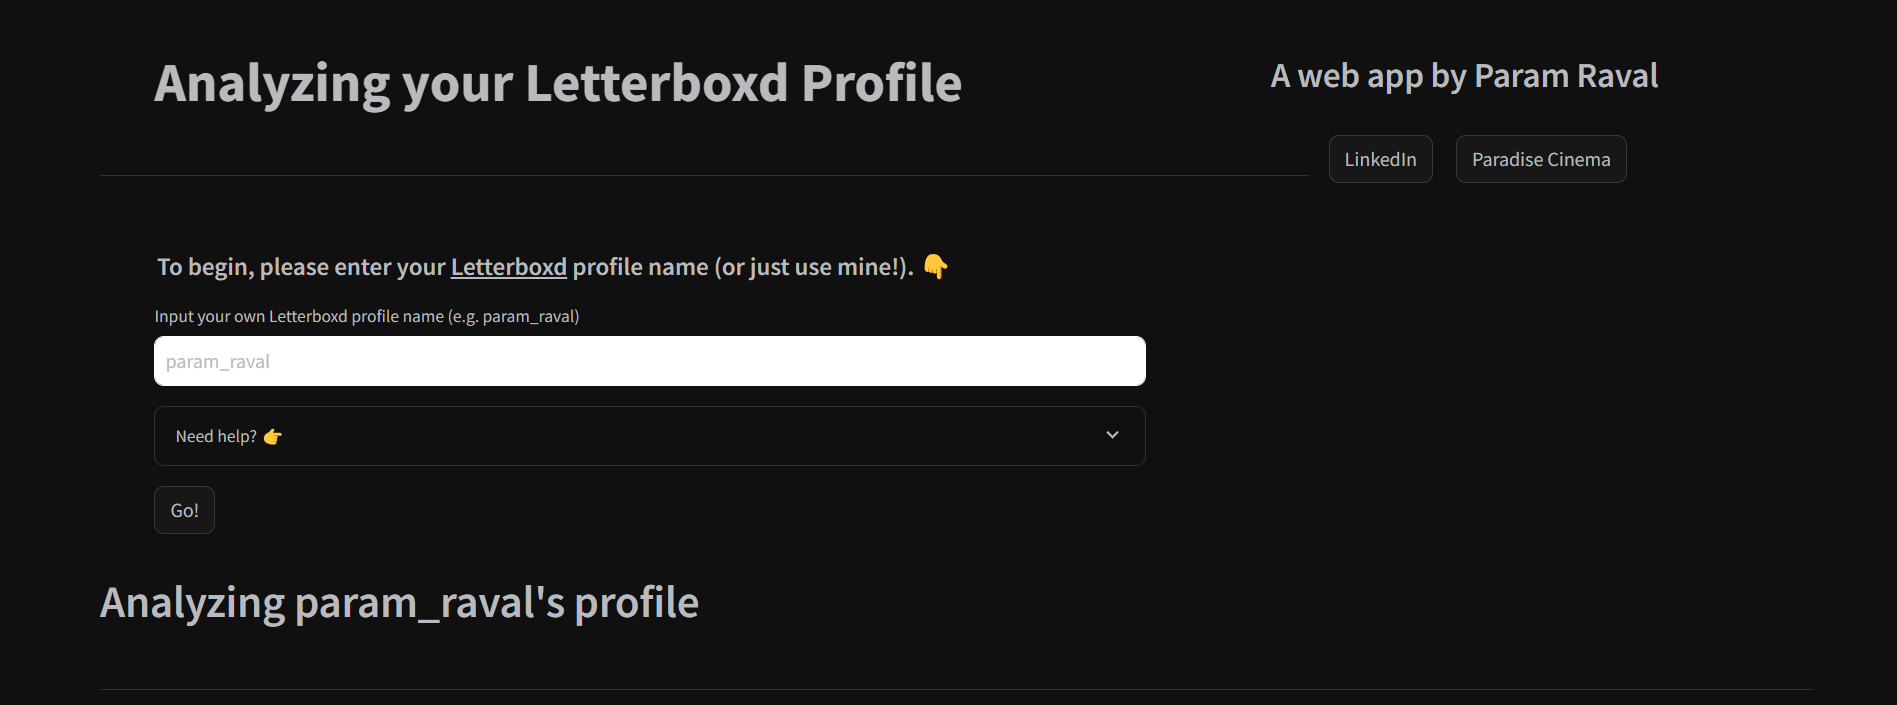
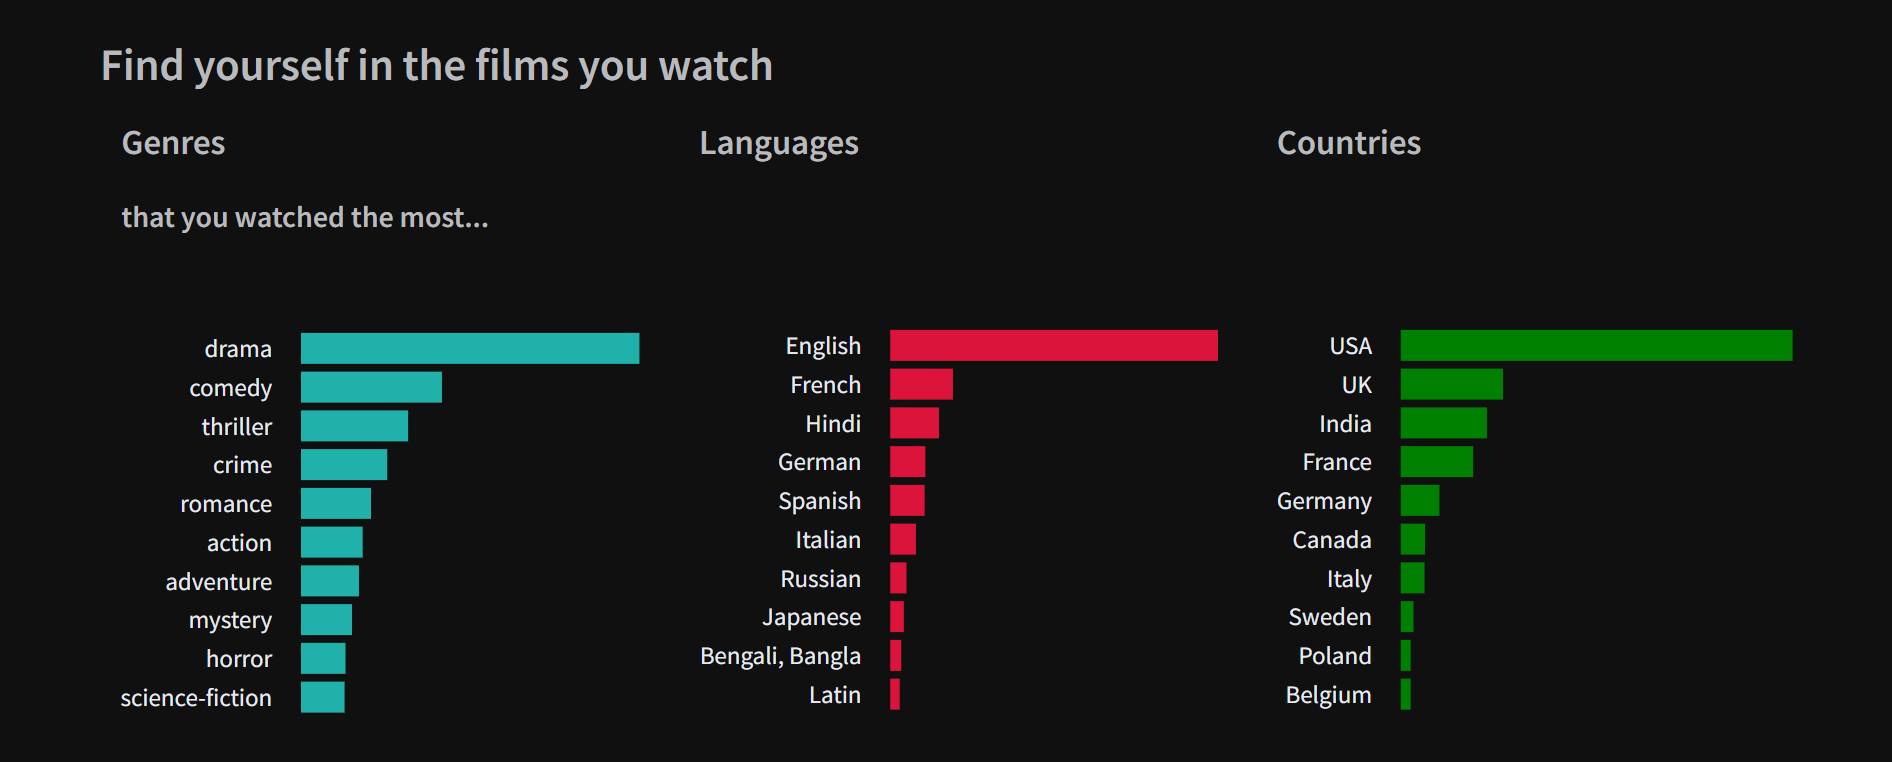
A web-app to get pretty charts that show your taste in films! The app uses public data from your Letterboxd profile and creates visuals that can usually be seen only by the Letterboxd Pro users!
Developed using Python, Plotly and Streamlit.
Note: the code is still pretty messy (to be fixed soon).
Use Python 3.9.10 or newer and install the requirements.
pip install -r requirements.txt
Run the app.py from the primary directory
streamlit app.py
Notes:
- Be patient if your profile has thousands of films logged and rated!
- This project is for educational purposes only. Support the Letterboxd Team and find out more here.


