If you like to access the data of your Tibber Pulse directly (instead via the detour through the cloud), then there is a simple approach to read the data directly from the Tibber Pulse Bridge. There are alternative solutions via an additional MQTT - but why should the data go through such a proxy, if it can be read directly.
If you want to join Tibber (become a customer), you might want to use my personal invitation link. When you use this link, Tibber will we grant you and me a bonus of 50,-€ for each of us. This bonus then can be used in the Tibber store ( not for your power bill) - e.g. to buy a Tibber Bridge. I am fully aware, that when you are here in this repository the chances are very high, that you are already a Tibber customer and have already a Tibber Pulse. If you are already a Tibber customer and have not used an invitation link yet, you can also enter one afterward in the Tibber App.
Please consider using my personal Tibber invitation link to join Tibber today or Enter the following code: 6o0kqvzf (six, oscar, zero, kilo, quebec, victor, zulu, foxtrot) afterward in the Tibber App - TIA!
-
The Tibber Pulse Bridge supporting different communication modes (when fetching data from electricity meter). Here I need your help! Obviously I have one electricity meter here at home. This meter is communicating via a protocol called SML 1.04 and this is currently the only one that is supported/implemented.
The Tibber Bridge supporting also the modes: AutoScanMode, IEC-62056.21, Logarex and Impressions (Blinks / kwh) using ambient or IR sensors. In order to support these other modes I would need sample data from you. If your Tibber Pulse using one of these communications protocols, please be so kind and create here an issue in github - TIA!
-
Sometimes the Pulse deliver a data-package that does not contain valid data (looks like the build in webserver have a response buffer issue?). These invalid packages can't be read with the python SML-Lib and you will find then in the HA-log some
Bytes missing...orCRC while parse data...messages. (when logging on INFO Level)If they happen the code will just try to load the data again for one time. Together with the message the actual payload (data that has been read from the Tibber Pulse Bridge) will also be logged. So you can verify that the data is indeed invalid.
- @spacemanspiff2007 for providing a Python SML lib that makes reading the data from the Pulse almost effortless for a python noob like me
- @ProfDrYoMan for providing the initial idea. I failed to setup the ESP32 stuff, so I took the approach writing this custom integration
To enable the web frontend permanently, one local variable needs to be set in the web frontend. But to get into the web frontend for the first time you need to start the Tibber Pulse Bridge in AccessPoint mode. This can be done by the following steps:
- Unplug the Tibber bridge.
- After three seconds, plug the Tibber bridge.
- After three seconds, unplug the Tibber bridge.
- After three seconds, plug the Tibber bridge.
The LED on the Tibber bridge should now light up green and not light blue anymore.
If this is not the case, then try this alternative:
- Unplug the Tibber bridge.
- Plug the Tibber bridge
- When the bridge light in yellow then unplug the bridge again
- Wait for a short while and plug in the bridge again after few seconds
NOW the LED on the Tibber bridge should now light up green and not light blue anymore.
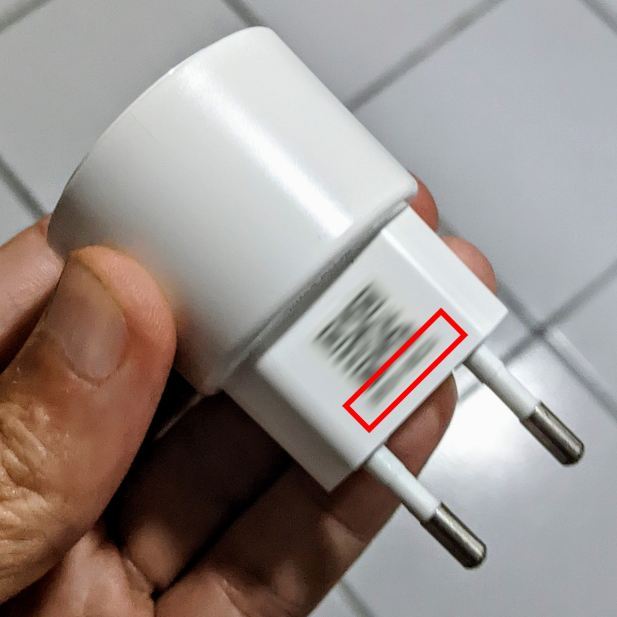
Now use any device (laptop, tablet, phone) to connect to the Tibber Bridge WiFi network. The password for the WiFi
is the nine characters printed on the Tibber bridge - it's important to include the dash. The password should have the
pattern like this example one: AD56-54BA.
After you are connected to the WiFi that have been created by the Pulse Bridge with your laptop/phone, use a web browser on that device to connect to http://10.133.70.1/. You will be prompted for a user and a password (BasicAuth).
The username is admin and the password is again the nine characters printed on the Tibber bridge.
When connected, select the param tab, there find and set the variable webserver_force_enable to true.
After setting and saving the value, remember to press "Store params to flash" on the bottom of the page.
Please do not modify and other values in the params
Unplug the Tibber bridge, wait ten seconds and plug it back again. Now it should connect back to your previously configured WiFi and should work as before (submit the data to Tibber) - the LED should light up light blue again.
After you have successfully reset the Tibber bridge (AP mode is OFF and you are back in normal operation mode). Since
you
have set the webserver_force_enable to true the web frontend should now be still accessible via the following URL:
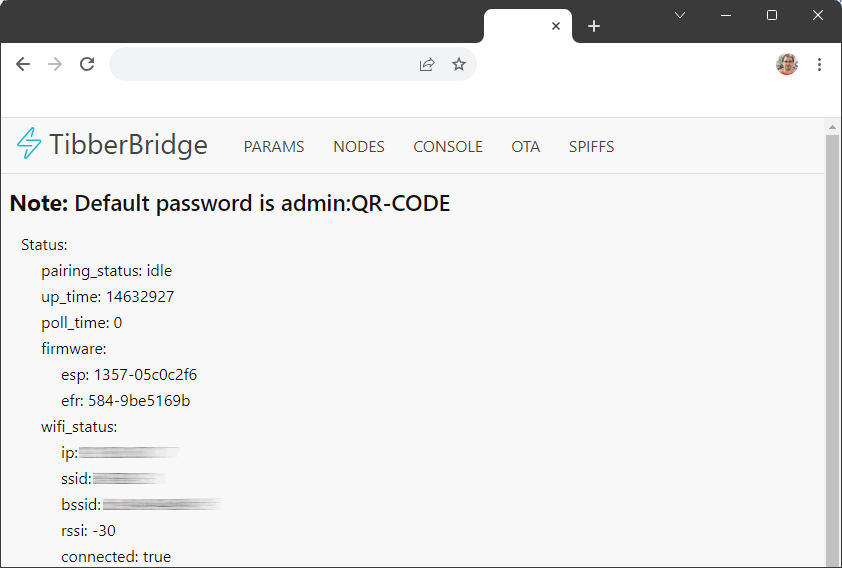
http://tibber-host/ or http://tibber-bridge/.
If the hostname 'tibber-host' (or 'tibber-bridge') is not going to work for you in your LAN, you might like to check the
IP-Address of your Tibber Pulse Bridge in your Router. The IP is not the 10.133.70.1 any longer!
Personally I have configured my router in a way, that the Pulse Bridge gets allways the same IP assigned. I just can recommend to do the same. Since accessing the device via IP (instead of the host name) will save you DNS-Lookups.
When you open the web frontend of the bridge, you have to provide the user admin and the password always.
Now (when the frontend works for you) all is prepared, so you can install and use this Tibber Local Polling
integration
- Install Home Assistant Community Store (HACS)
- Add custom repository https://github.com/marq24/ha-tibber-pulse-local to HACS
- Add integration repository (search for "Tibber Pulse Local" in "Explore & Download Repositories")
- Select latest version or
master
- Select latest version or
- Restart Home Assistant to install all dependencies
- Copy all files from
custom_components/tibber_local/tocustom_components/tibber_local/inside your config Home Assistant directory. - Restart Home Assistant to install all dependencies
Add custom integration using the web interface and follow instruction on screen.
- Go to
Configuration -> Integrationsand add "Tibber Pulse Local" integration - Specify:
- Provide display name for the device
- Provide the address (hostname or IP) of the Pulse Bridge
- Provide the password of the Pulse Bridge
- Provide the update interval (can be 2 Seconds)
- Provide area where the Tibber Pule Bridge is located
Beside the data that the Tibber Pulse is reading from your electricity meter, the device is also provide additional information about its own status. Since the assumption is that you want to read this additional status information with a much lower update-interval (less frequent) the usage of a REST-Entity template a (IMHO) simple way to archive your goal.
requesting http://admin:[BRIDGE_PASSWORD]@[YOUR_IP]/metrics.json?node_id=1 will return a json like this one
here
{
  "$type": "node_status",
  "node_status": {
    "product_id": 49344,
    "bootloader_version": 17563650,
    "meter_mode": 3,
    "node_battery_voltage": 3.127,
    "node_temperature": 22.51,
    "node_avg_rssi": -72.746,
    "node_avg_lqi": 186.438,
    "radio_tx_power": 190,
    "node_uptime_ms": 167656940,
    "meter_msg_count_sent": 75,
    "meter_pkg_count_sent": 237,
    "time_in_em0_ms": 8405,
    "time_in_em1_ms": 30,
    "time_in_em2_ms": 291717,
    "acmp_rx_autolevel_300": 146,
    "acmp_rx_autolevel_9600": 164
  },
  "hub_attachments": {
    "meter_pkg_count_recv": 237,
    "meter_reading_count_recv": 75,
    "node_version": "1007-56bd9fb9"
  }
}
Check if you have already a sensor section in your configuration.yaml file - if there is none - create one on as top
level entry like this (the line ' - platforms: ...' must (obviously) be replaced with the complete sections shown
further below):
sensor:
  - platform: ...
Add in the sensor section of your configuration.yaml file the following content:
sections with [ CHANGE_ME:xxx ] have to be modified to your requirements. E.g. assuming your assuming password
is 55AA-CC21, then you have to replace [ CHANGE_ME:YOUR_PASSWORD ] with just 55AA-CC21
  - platform: rest
    name: [ CHANGE_ME:Tibber Prices ]
    unique_id: [ CHANGE_ME:tibber_prices ]
    resource: http://admin:[ CHANGE_ME:YOUR_PASSWORD ]@[ CHANGE_ME:YOUR_IP ]/metrics.json?node_id=1
    method: GET
    json_attributes_path: "node_status"
    json_attributes:
      - node_temperature
      - node_avg_rssi
      - radio_tx_power
      - [ CHANGE_ME: add/remove as many of the node_status attributes you want to meassure/do not need ]
    value_template: "{{ value_json.node_status.node_battery_voltage | float }}"
    # the scan_interval will be specified in seconds...
    # for update every 5min use 300 (60sec * 5min = 300sec)
    # for update every 15min use 900 (60sec * 15min = 900sec)
    # for update every 1h use 3600 (60sec * 60min = 3600sec)
    # for update every 24h use 86400 (60sec * 60min * 24h = 86400sec)
    scan_interval: 900
    headers:
      Content-Type: application/json
      User-Agent: REST
    unit_of_measurement: [ CHANGE_ME:A_UNIT_HERE ]
Here is a complete example assuming the password is 55AA-CC21 the IP is 192.168.2.213, and you want to capture
the node_battery_voltage as main entity information and all other children of the node_status as additional
attributes of the entity that will be requested every 5 minutes:
  - platform: rest
    name: Tibber Pulse Metrics
    unique_id: tibber_pulse_metrics
    resource: http://admin:55AA-CC21@192.168.2.213/metrics.json?node_id=1
    method: GET
    json_attributes_path: "node_status"
    json_attributes:
      - node_temperature
      - node_avg_rssi
      - node_avg_lqi
      - radio_tx_power
      - node_uptime_ms
      - meter_msg_count_sent
      - meter_pkg_count_sent
      - time_in_em0_ms
      - time_in_em1_ms
      - time_in_em2_ms
      - acmp_rx_autolevel_300
      - acmp_rx_autolevel_9600
    value_template: "{{ value_json.node_status.node_battery_voltage | float }}"
    scan_interval: 300
    headers:
      Content-Type: application/json
      User-Agent: REST
    unit_of_measurement: V
Here just another example with just a single value (without additional atributes) that will update every hour (just
again have in mind, that this yaml section have to be under your sensor section of your configuration.yaml file):
  - platform: rest
    name: Tibber Pulse Metrics
    unique_id: tibber_pulse_metrics
    resource: http://admin:55AA-CC21@192.168.2.213/metrics.json?node_id=1
    method: GET
    value_template: "{{ value_json.node_status.node_battery_voltage | float }}"
    scan_interval: 3600
    headers:
      Content-Type: application/json
      User-Agent: REST
    unit_of_measurement: V


