tidycensus
tidycensus is an R package that allows users to interface with the US Census Bureau's decennial Census and five-year American Community APIs and return tidyverse-ready data frames, optionally with simple feature geometry included. Install from CRAN with the following command:
install.packages("tidycensus")Want to learn how to use tidycensus? Take the DataCamp course Analyzing US Census Data in R!
In version 0.8.1:
-
tidycensus now includes support for the Census Bureau Population Estimates API. Please see https://walkerke.github.io/tidycensus/articles/other-datasets.html for examples of how to use these new features.
-
Important internal changes to ensure that tidycensus continues to work with upcoming changes to Census API endpoints.
-
Several internal improvements and bug fixes. Please see the closed issues at https://github.com/walkerke/tidycensus/issues for a list.
In version 0.4.6:
-
Bug fixed that was causing GEOIDs for some states to be converted to NA on certain Linux platforms
-
A new parameter,
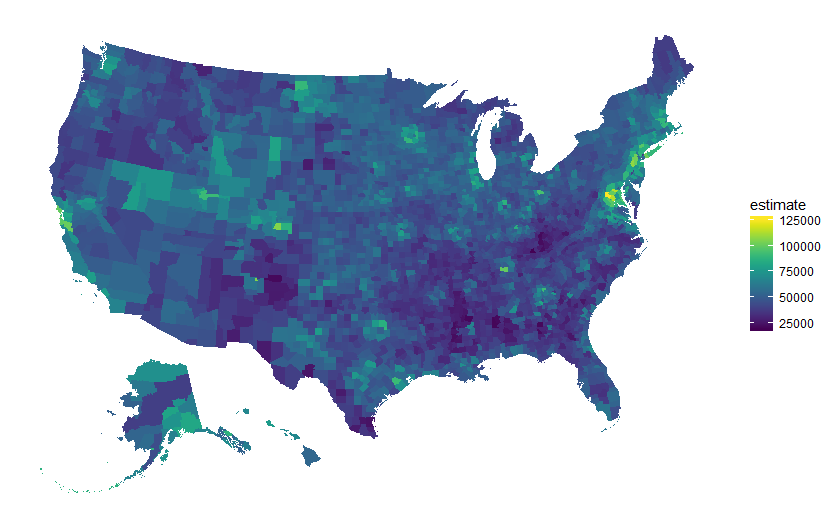
shift_geo, allows tidycensus users to get US state and county geometry originally obtained with the albersusa R package with Alaska and Hawaii shifted and re-scaled for better cartographic display of the entire US.
library(tidycensus)
library(tidyverse)
library(viridis)

us_county_income <- get_acs(geography = "county", variables = "B19013_001",
                            shift_geo = TRUE, geometry = TRUE)

ggplot(us_county_income) +
  geom_sf(aes(fill = estimate), color = NA) +
  coord_sf(datum = NA) +
  theme_minimal() +
  scale_fill_viridis()
In version 0.4:
-
tidycensus now defaults to the new 2012-2016 five-year ACS estimates in
get_acs(). -
By passing a named vector to the
variablesparameter inget_acs()orget_decennial(), tidycensus will let you define your own variable names rather than the Census ID codes. For example:
racevars <- c(White = "P0050003",
              Black = "P0050004",
              Asian = "P0050006",
              Hispanic = "P0040003")

harris <- get_decennial(geography = "tract", variables = racevars,
                  state = "TX", county = "Harris County", geometry = TRUE,
                  summary_var = "P0010001")

head(harris)

## Simple feature collection with 6 features and 5 fields
## geometry type:  MULTIPOLYGON
## dimension:      XY
## bbox:           xmin: -95.37457 ymin: 29.74486 xmax: -95.32409 ymax: 29.80907
## epsg (SRID):    4269
## proj4string:    +proj=longlat +datum=NAD83 +no_defs
## # A tibble: 6 x 6
##         GEOID              NAME variable value summary_value
##         <chr>             <chr>    <chr> <dbl>         <dbl>
## 1 48201100000 Census Tract 1000    White  2082          4690
## 2 48201100000 Census Tract 1000    Black  1047          4690
## 3 48201100000 Census Tract 1000    Asian   134          4690
## 4 48201100000 Census Tract 1000 Hispanic  1070          4690
## 5 48201210900 Census Tract 2109    White    35          1620
## 6 48201210900 Census Tract 2109    Black  1195          1620
## # ... with 1 more variables: geometry <S3: sfc_MULTIPOLYGON>-
The
countyandstateparameters now work whengeographyis set to"county"and"state", respectively. -
The
moe_sum()function now avoids inflating the derived margin of error when multiple zero estimates are involved. -
Variables without associated margins of error (e.g. B00001_001) can now be obtained with
get_acs().
In version 0.3.1:
- Error fixed due to duplicated county polygons in the 1990 and 2000 Census geometries
New in version 0.3:
- Get an entire table of decennial Census or ACS data by supplying the table name. For example, to get the entire ACS table B01001 from the 2016 1-year ACS (assuming here that you've already installed your Census API key with
census_api_key("KEY", install = TRUE):
library(tidycensus)

df <- get_acs(geography = "state", table = "B01001", survey = "acs1", year = 2016)
The table parameter fetches a variable list from the Census Bureau website to perform table lookup. To cache the variable list on your computer for faster use of the table parameter in the future, set cache_table = TRUE the first time you fetch a table for a particular dataset.
Why tidycensus?
My work heavily involves the use of data from the US Census Bureau, and like many R users, I do most of my work within the tidyverse. Beyond this, the sf package now allows R users to work with spatial data in an integrated way with tidyverse tools, and updates to the tigris package provide access to Census boundary data as sf objects. Recently, I've found myself writing the same routines over and over to get Census data ready for use with tidyverse packages and sf. This motivated me to wrap these functions in a package and open-source in case other R users find them useful.
tidycensus is designed to help R users get Census data that is pre-prepared for exploration within the tidyverse, and optionally spatially with sf. To learn more about how the package works, I encourage you to read the following articles:
Future development
To keep up with on-going development of tidycensus and get even more examples of how to use the package, subscribe to my email list by clicking here (no spam, I promise!). You'll also get updates on the development of my upcoming book with CRC Press, Analyzing the US Census with R.
You can also follow my blog at https://walkerke.github.io.
My development focus is on making the current datasets as accessible as possible; if you need other approaches or datasets, I recommend the censusapi and acs packages.
If you find this project useful, you can support package development in the following ways:
- Hiring me as a consultant to help you use tidycensus in your project, or hiring me to give a workshop on tidycensus for your organization. Please contact me at kwalkerdata@gmail.com if you are interested!
- Filing an issue - or even better, a pull request - at https://github.com/walkerke/tidycensus/issues.
Note: This product uses the Census Bureau Data API but is not endorsed or certified by the Census Bureau.
