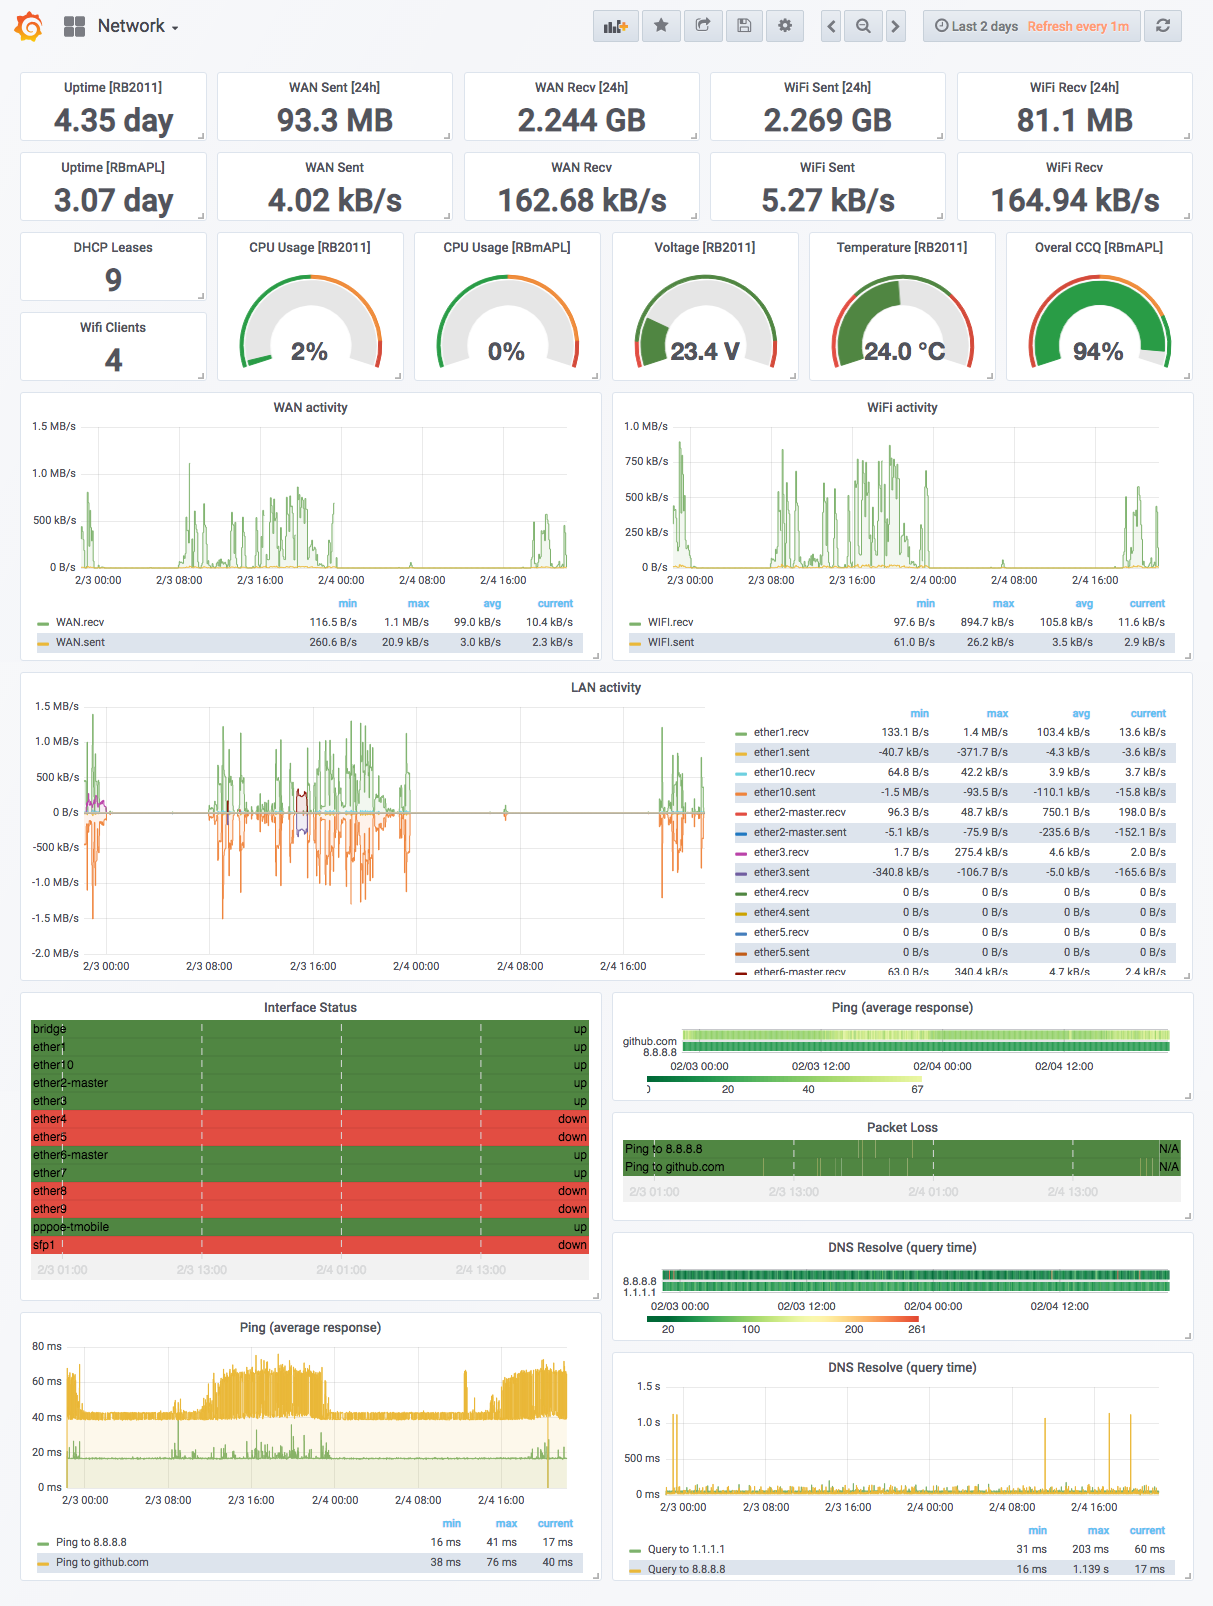
This is simple network monitoring I use in my home network.
My network is quite simple -- one router Mikrotik RB2011 with IP address
10.0.0.1 and one WiFi AP Mikrotik RBmAPL with IP address 10.0.0.2.
Note: if you have diferent network settings, you should change extra_hosts
setting in docker-compose file. Or you can completely change SNMP configuration
in ./etc/telegraf.conf file.
Enable SNMP on all Mikrotik device you want to monitor:
/snmp community set [ find default=yes ] name=telegraf
/snmp set enabled=yes
Optional: if you want to collect logs from your Mikrotik devices, you have to set "remote" action:
# Change 10.0.0.3 to you RPi's IP address.
/system logging action set remote bsd-syslog=yes remote=10.0.0.3

# Add all log level you wan to send.
/system logging add action=remote topics=info
/system logging add action=remote topics=error
/system logging add action=remote topics=warning
/system logging add action=remote topics=critical
Install Docker on Raspberry Pi:
$ curl -sSL https://get.docker.com | sh
# Note: Previous command can be a little dangerous. If you dont like to
# Note: pipe "unknown" script directly to shell, you can run it manually:
# $ curl -sSL https://get.docker.com > docker.sh
# $ sh docker.sh

# Add `pi` user to `docker` group, so you don't have to use `sudo docker`.
$ sudo usermod -aG docker pi

# Install `docker-compose`
$ sudo apt-get install docker-compose
After this you should be able to start InfluxDB, Telegraf and Grafana containers:
$ git clone https://github.com/slintak/network_monitoring.git
$ cd network_monitoring
$ docker-compose up -d
Syslog input in Telegraf works only with messages encoded in RFC5424 format. The Mikrotik on the other hand sends RFC3164 so we have to use rsyslog to change formats.
Mikrotik -------> rsyslog --------> Telegraf
         :514/UDP         :6514/UDP
          RFC3164          RFC5424
The latest Raspbian OS has rsyslog already installed and running. All you
need to do is copy configuration file and restart rsyslog daemon:
# On Raspberry Pi

sudo ln -s /home/pi/network_monitoring/etc/rsyslog.d/mikrotik.conf /etc/rsyslog.d/mikrotik.conf
sudo systemctl restart rsyslog
Main Grafana dashboard can be found in dashboards/network.json. To use this
dashboard you need to import it in your Grafana and set three variables:
Main Wifi AP Hostname-- hostname of your WiFi acccess point.Main Router Hostaname-- hostname of your main router.Name of WAN Interface-- name of WAN interface on main router.
Setting custom hostname on Mikrotik devices can be done by command
/system identity set name="your-hostname".
